

Question
Below are the historical closing prices for the two funds above. Use excel to solve the below question for the above mentioned data set and
Below are the historical closing prices for the two funds above.
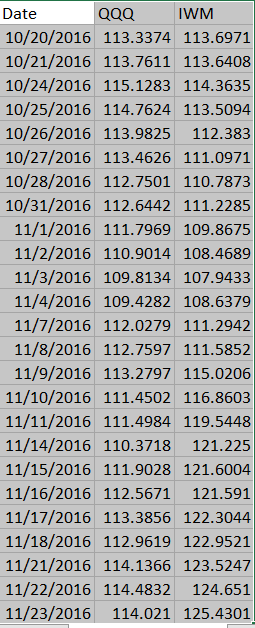
Use excel to solve the below question for the above mentioned data set and show the steps.
Q) a) Calculate the correlation between the two funds ?
b) Calculate the covariance between the two funds using a) Excel function, Covariance.S and using formula (Correlation multiplied by standard deviations of both funds.
Date QQQ IWM 10/20/2016 113.3374 113.6971 10/21/2016 113.7611 113.6408 10/24/2016 115.1283 114.3635 10/25/2016 114.7624 113.5094 10/26/2016 113.9825 112.383 10/27/2016 113.4626 111.0971 10/28/2016 112.7501 110.7873 10/31/2016 112.6442 111.2285 11/1/2016 111.7969 109.8675 11/2/2016 110.9014 108.4689 11/3/2016 109.8134 107.9433 11/4/2016 109.4282 108.6379 11/7/2016 112.0279 111.2942 11/8/2016 112.7597 111.5852 11/9/2016 113.2797 115.0206 11/10/2016 111.4502 116.8603 11/11/2016 111.4984 119.5448 11/14/2016 110.3718 121.225 11/15/2016 111.9028 121.6004 11/16/2016 112.5671 121.591 11/17/2016 113.3856 122.3044 11/18/2016 112.9619 122.9521 11/21/2016 114.1366 123.5247 11/22/2016 114.4832 124.651 11/23/2016 114.021 125.4301Step by Step Solution
There are 3 Steps involved in it
Step: 1

Get Instant Access to Expert-Tailored Solutions
See step-by-step solutions with expert insights and AI powered tools for academic success
Step: 2

Step: 3
Ace Your Homework with AI
Get the answers you need in no time with our AI-driven, step-by-step assistance
Get Started
The Venture Capital Investment Process
Authors: Darek Klonowski
1st Edition
0230612881, 023011007X, 9780230612884, 9780230110076