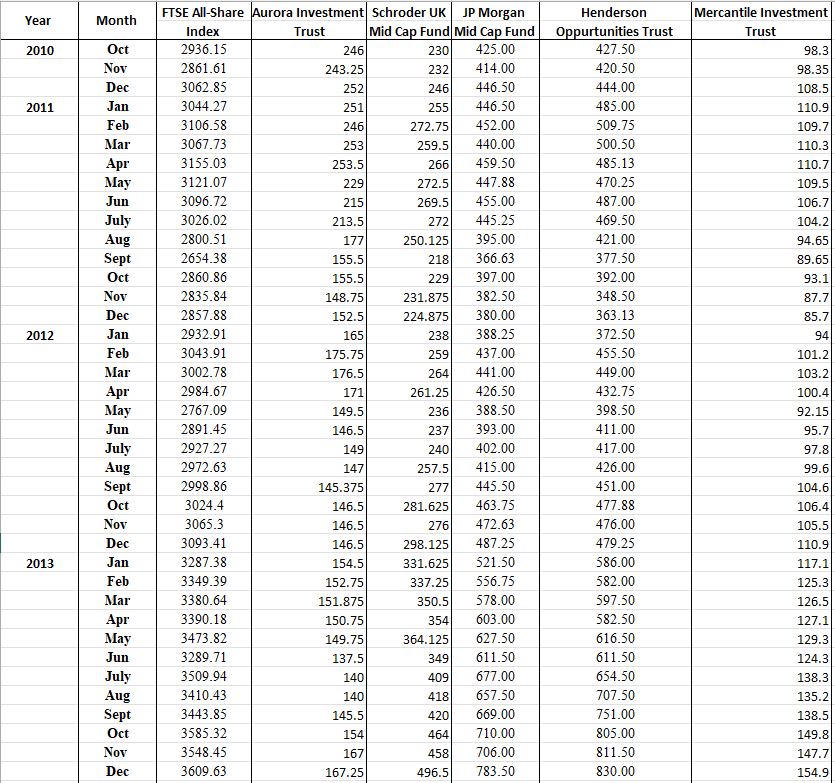
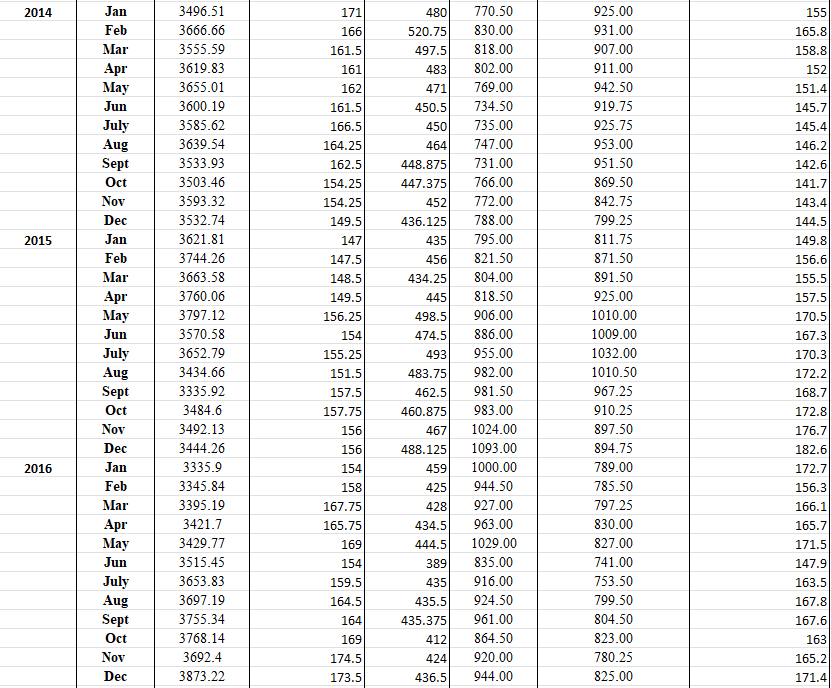
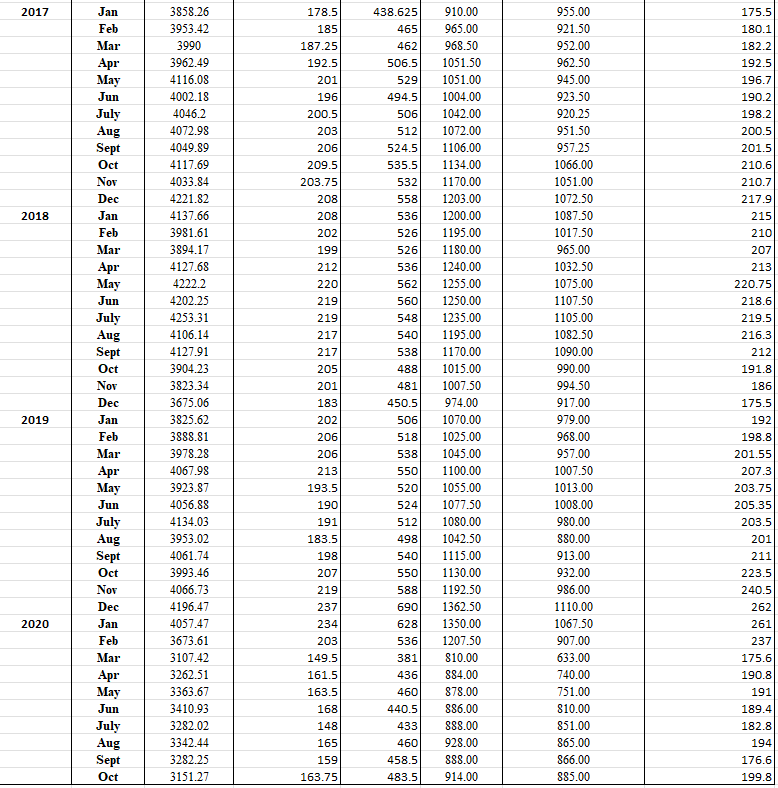
Below are the monthly share prices of five UK investment trusts for the period October 2010 to October 2020 (10 years at the monthly frequency).


Required:

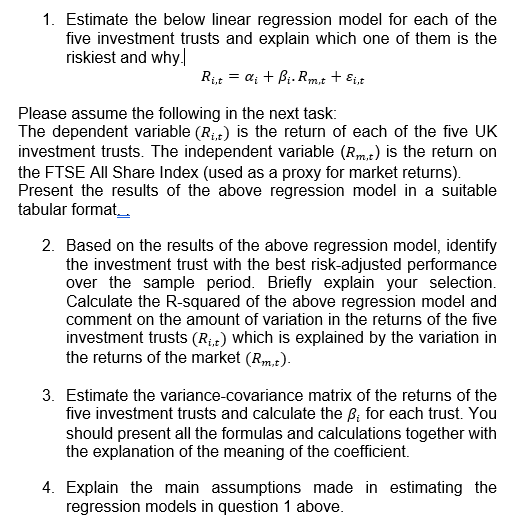
Year Month Mercantile Investment Trust 98.3 2010 2011 98.35 108.5 110.9 109.7 110.3 110.7 109.5 106.7 104.2 94.65 89.65 93.1 87.7 2012 85.7 94 101.2 103.2 FTSE All-Share Aurora Investment Schroder UK JP Morgan Henderson Index Trust Mid Cap Fund Mid Cap Fund Oppurtunities Trust 2936.15 246 230 425.00 427.50 2861.61 243.25 232 414.00 420.50 3062.85 252 246 446.50 444.00 3044.27 251 255 446.50 485.00 3106.58 246 272.75 452.00 509.75 3067.73 253 259.5 440.00 500.50 3155.03 253.5 266 459.50 485.13 3121.07 229 272.5 447.88 470.25 3096.72 215 269.5 455.00 487.00 3026.02 213.5 272) 445.25 469.50 2800.51 177 250.125 395.00 421.00 2654.38 155.5 218 366.63 377.50 2860.86 155.5 229 397.00 392.00 2835.84 148.75 231.875 382.50 348.50 2857.88 152.5 224.875 380.00 363.13 2932.91 165 238 388.25 372.50 3043.91 175.75 259 437.00 455.50 3002.78 176.5 264 441.00 449.00 2984.67 171 261.25 426.50 432.75 2767.09 149.5 236 388.50 398.50 2891.45 146.5 237 393.00 411.00 2927.27 149 240 402.00 417.00 2972.63 147 257.5 415.00 426.00 2998.86 145.375 277 445.50 451.00 3024.4 146.5 281.625 463.75 477.88 3065.3 146.5 276 472.63 476.00 3093.41 146.5 298.125 487.25 479.25 3287.38 154.5 331.625 521.50 586.00 3349.39 152.75 337.25 556.75 582.00 3380.64 151.875 350.5 578.00 597.50 3390.18 150.75 354 603.00 582.50 3473.82 149.75 364.125 627.50 616.50 3289.71 137.5 349 611.50 611.50 3509.94 140 409 677.00 654.50 3410.43 140 418 657.50 707.50 3443.85 145.5 420 669.00 751.00 3585.32 154 464 710.00 805.00 3548.45 167 458 706.00 811.50 3609.63 167.25 496.5 783.50 830.00 Oct Nov Dec Jan Feb Mar Apr May Jun July Aug Sept Oct Nov Dec Jan Feb Mar Apr May Jun July Aug Sept Oct Nov Dec Jan Feb Mar Apr May Jun July Aug Sept Oct Nov Dec 100.4 92.15 95.7 97.8 99.6 104.6 106.4 105.5 110.9 117.1 125.3 2013 126.5 127.1 129.3 124.3 138.3 135.2 138.5 149.8 147.7 154.9 2014 171 166 155 165.8 161.5 161 480 520.75 497.5 483 471 450.5 450 162 161.5 166.5 158.8 152 151.4 145.7 145.4 146.2 142.6 141.7 143.4 164.25 162.5 154.25 154.25 149.5 464 448.875 447.375 452 436.125 435 456 434.25 445 144.5 2015 147 149.8 156.6 155.5 157.5 Jan Feb Mar Apr May Jun July Aug Sept Oct Nov Dec Jan Feb Mar Apr May Jun July Aug Sept Oct Nov Dec Jan Feb Mar Apr May Jun July Aug Sept Oct Nov Dec 498.5 3496.51 3666.66 3555.59 3619.83 3655.01 3600.19 3585.62 3639.54 3533.93 3503.46 3593.32 3532.74 3621.81 3744.26 3663.58 3760.06 3797.12 3570.58 3652.79 3434.66 3335.92 3484.6 3492.13 3444.26 3335.9 3345.84 3395.19 3421.7 3429.77 3515.45 3653.83 3697.19 3755.34 3768.14 3692.4 3873.22 147.5 148.5 149.5 156.25 154 155.25 151.5 770.50 830.00 818.00 802.00 769.00 734.50 735.00 747.00 731.00 766.00 772.00 788.00 795.00 821.50 804.00 818.50 906.00 886.00 955.00 982.00 981.50 983.00 1024.00 1093.00 1000.00 944.50 927.00 963.00 1029.00 835.00 916.00 924.50 961.00 864.50 920.00 944.00 925.00 931.00 907.00 911.00 942.50 919.75 925.75 953.00 951.50 869.50 842.75 799.25 811.75 871.50 891.50 925.00 1010.00 1009.00 1032.00 1010.50 967.25 910.25 897.50 894.75 789.00 785.50 797.25 830.00 827.00 741.00 753.50 799.50 804.50 823.00 780.25 825.00 170.5 167.3 170.3 172.2 157.5 474.5 493 483.75 462.5 460.875 467 488.125 459) 425 428 434.5 444.5 389 435 168.7 157.75 156 156 154 158 2016 172.8 176.7 182.6 172.7 156.3 166.1 165.7 171.5 147.9 167.75 165.75 169 154 159.5 164.5 164 169 174.5 173.5 163.5 167.8 435.5 435.375 412 424 436.5 167.6 163 165.2 171.4 2017 Jan Feb Mar Apr May Jun July Aug Sept Oct Nov Dec Jan Feb Mar Apr May Jun July Aug Sept Oct Nov Dec Jan Feb Mar Apr May Jun July Aug Sept 438.625 465) 462 506.5 529 494.5 506 512 524.5 535.5 532 558 536 526 526 536 562 560 548 540 538 2018 3858.26 3953.42 3990 3962.49 4116.08 4002.18 4046.2 4072.98 4049.89 4117.69 4033.84 4221.82 4137.66 3981.61 3894.17 4127.68 4222.2 4202.25 4253.31 4106.14 4127.91 3904.23 3823.34 3675.06 3825.62 3888.81 3978.28 4067.98 3923.87 4056.88 4134.03 3953.02 4061.74 3993.46 4066.73 4196.47 4057.47 3673.61 3107.42 3262.51 3363.67 3410.93 3282.02 3342.44 3282.25 3151.27 178.5 1851 187.25 192.5 201 196 200.5 203 206 209.5 203.75 208 208 202 199 212 220 219 219 217 217 2051 201 183 202 206 206 213 193.5 190 191 183.5 198 207 219 237 234 203 149.5 161.5 163.5 168 148 165 159 163.75 910.00 965.00 968.50 1051.50 1051.00 1004.00 1042.00 1072.00 1106.00 1134.00 1170.00 1203.00 1200.00 1195.00 1180.00 1240.00 1255.00 1250.00 1235.00 1195.00 1170.00 1015.00 1007.50 974.00 1070.00 1025.00 1045.00 1100.00 1055.00 1077.50 1080.00 1042.50 1115.00 1130.00 1192.50 1362.50 1350.00 1207.50 810.00 884.00 878.00 886.00 888.00 928.00 888.00 914.00 955.00 921.50 952.00 962.50 945.00 923.50 920.25 951.50 957.25 1066.00 1051.00 1072.50 1087.50 1017.50 965.00 1032.50 1075.00 1107.50 1105.00 1082.50 1090.00 990.00 994.50 917.00 979.00 968.00 957.00 1007.50 1013.00 1008.00 980.00 880.00 913.00 932.00 986.00 1110.00 1067.50 907.00 633.00 740.00 751.00 810.00 851.00 865.00 866.00 885.00 488 481 450.5 506 518 538 550 520 5241 512 498 540 550 588 690 628 536) 381 436 460 440.5 433 4601 458.5 483.5 175.5 180.1 182.2 192.5 196.7 190.2 198.2 200.5 201.5 210.6 210.7 217.9 215 210 207 213 220.75 218.6 219.5 216.3 212 191.8 186 175.5 192 198.8 201.55 207.3 203.75 205.35 203.5 201 211 223.5 240.5 262 261 237 175.6 190.8 191 189.4 182.8 194 176.6 199.8 2019 Oct Nov Dec 2020 Jan Feb Mar Apr May Jun July Aug Sept Oct 1. Estimate the below linear regression model for each of the five investment trusts and explain which one of them is the riskiest and why. Rit = a + B. Rmt + Fit = Please assume the following in the next task: The dependent variable (Rit) is the return of each of the five UK investment trusts. The independent variable (Rmt) is the return on the FTSE All Share Index (used as a proxy for market returns). Present the results of the above regression model in a suitable tabular format_. 2. Based on the results of the above regression model, identify the investment trust with the best risk-adjusted performance over the sample period. Briefly explain your selection. Calculate the R-squared of the above regression model and comment on the amount of variation in the returns of the five investment trusts (Ri,t) which is explained by the variation in the returns of the market (Rm,t). 3. Estimate the variance covariance matrix of the returns of the five investment trusts and calculate the B; for each trust. You should present all the formulas and calculations together with the explanation of the meaning of the coefficient. 4. Explain the main assumptions made in estimating the regression models in question 1 above


