Answered step by step
Verified Expert Solution
Link Copied!

Question

1 Approved Answer

Below are the real data of the Nasdaq and the Bitcoin over a 4-day period. William would like you to help him calculate the 3-day

Below are the real data of the Nasdaq and the Bitcoin over a 4-day period. William would like you to help him calculate the 3-day average Amihud illiquidity measure in billions.

What conclusion you could obtain after calculating the Amihud measure?image text in transcribed
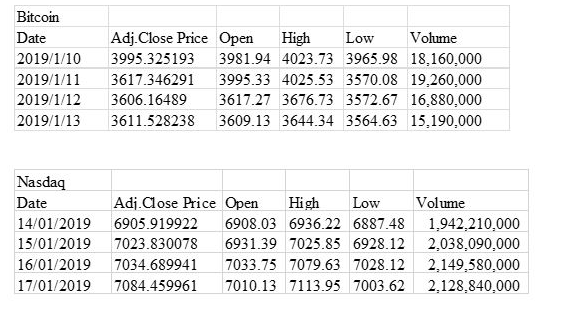
Bitcoin Date 2019/1/10 2019/1/11 2019/1/12 2019/1/13 Adj.Close Price Open High Low Volume 3995 325193 3981.94 4023.73 3965.98 18.160.000 3617.346291 3995.33 4025.53 3570.08 19.260,000 3606.16489 3617.27 3676.73 3572.67 16.880.000 3611.528238 3609.13 3644.34 3564.63 15,190,000 Nasdaq Date 14/01/2019 15/01/2019 16/01/2019 17/01/2019 Adj.Close Price Open High Low 6905.919922 6908.03 6936.22 6887.48 7023.830078 6931.39 7025.85 6928.12 7034.689941 7033.75 7079.63 7028.12 7084.459961 7010.13 7113.95 7003.62 Volume 1,942,210,000 2,038.090.000 2,149,580,000 2.128.840.000

Step by Step Solution

There are 3 Steps involved in it

Step: 1

blur-text-image

Get Instant Access to Expert-Tailored Solutions

See step-by-step solutions with expert insights and AI powered tools for academic success

Step: 2

blur-text-image_2

Step: 3

blur-text-image_3

Ace Your Homework with AI

Get the answers you need in no time with our AI-driven, step-by-step assistance

Get Started

Recommended Textbook for

Applied Equity Analysis and Portfolio Management Tools to Analyze and Manage Your Stock Portfolio

Authors: Robert A.Weigand

1st edition

978-111863091, 1118630912, 978-1118630914

More Books

Students also viewed these Finance questions

Question

LO2.5 Describe the mechanics of the circular flow model.

Answered: 1 week ago

Question

LO2.6 Explain how the market system deals with risk.

Answered: 1 week ago