below are the support documents


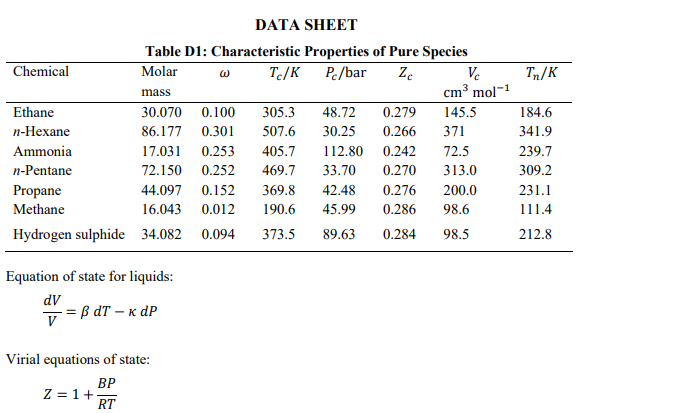
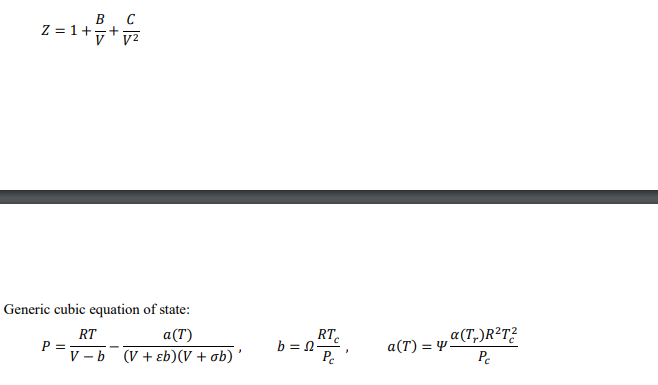
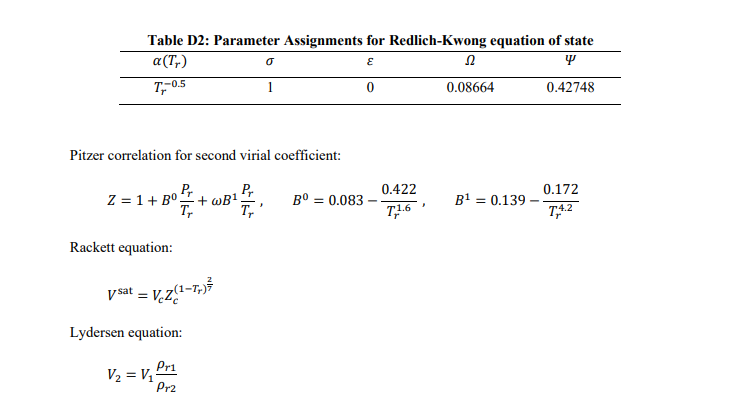
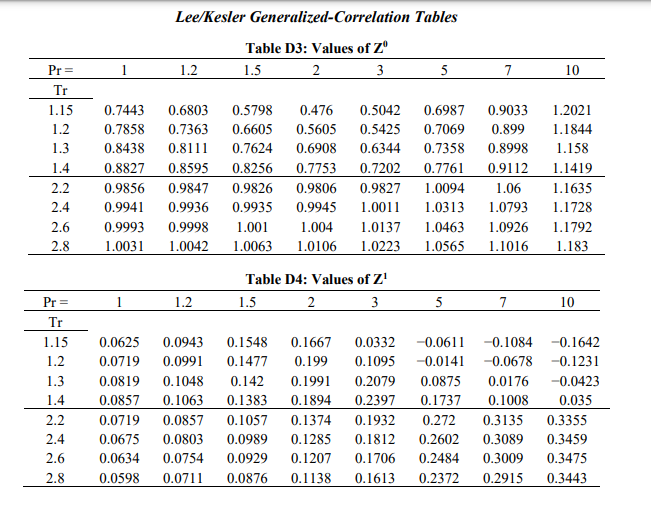
Estimate the change in volume when liquid ammonia at a pressure of 56 bar is vapourised to a final pressure of 2 bar while maintaining the temperature at 10C. The vapour pressure of ammonia at 10C is 6.2 bar. [9 marks) A closed vessel holds methane vapor at 200C and 200 bar. If it is cooled to 20C, what will be the final pressure? [10 marks) Tn/K DATA SHEET Table D1: Characteristic Properties of Pure Species Chemical Molar w Tc/K Pc/bar Zc Vc mass cm mol-1 Ethane 30.070 0.100 305.3 48.72 0.279 145.5 n-Hexane 86.177 0.301 507.6 30.25 0.266 371 Ammonia 17.031 0.253 405.7 112.80 0.242 72.5 n-Pentane 72.150 0.252 469.7 33.70 0.270 313.0 Propane 44.097 0.152 369.8 42.48 0.276 200.0 Methane 16.043 0.012 190.6 45.99 0.286 98.6 Hydrogen sulphide 34.082 0.094 373.5 89.63 0.284 98.5 184.6 341.9 239.7 309.2 231.1 111.4 212.8 Equation of state for liquids: dV V = B dT - KdP Virial equations of state: BP Z = 1 + RT B 2= z = 1+t v2 Generic cubic equation of state: RT a(T) P V-b (V + b)(V + ob)' RT b=25 Pc a(T) = y a(T)R?T? . Table D2: Parameter Assignments for Redlich-Kwong equation of state a(T6) 12 T:-0.5 1 0 0.08664 0.42748 o E Pitzer correlation for second virial coefficient: Z=1+B+wB T PP T B = 0.083 0.422 7,16' B1 = 0.139 0.172 7,4.2 Rackett equation: ysat = VZ(1-T;) Lydersen equation: Pri V2 = V1 Pr2 Lee/Kesler Generalized-Correlation Tables Table D3: Values of Z 1.2 1.5 2 3 5 1 7 10 Pr= Tr 1.15 1.2 1.3 1.4 2.2 2.4 2.6 2.8 0.7443 0.7858 0.8438 0.8827 0.9856 0.9941 0.9993 1.0031 0.6803 0.7363 0.8111 0.8595 0.9847 0.9936 0.9998 1.0042 0.5798 0.6605 0.7624 0.8256 0.9826 0.9935 1.001 1.0063 0.476 0.5605 0.6908 0.7753 0.9806 0.9945 1.004 1.0106 0.5042 0.5425 0.6344 0.7202 0.9827 1.0011 1.0137 1.0223 0.6987 0.7069 0.7358 0.7761 1.0094 1.0313 1.0463 1.0565 0.9033 0.899 0.8998 0.9112 1.06 1.0793 1.0926 1.1016 1.2021 1.1844 1.158 1.1419 1.1635 1.1728 1.1792 1.183 Table D4: Values of Z 1.5 2 3 1 1.2 5 7 10 Pr = Tr 1.15 1.2 1.3 1.4 2.2 2.4 2.6 2.8 0.0625 0.0719 0.0819 0.0857 0.0719 0.0675 0.0634 0.0598 0.0943 0.0991 0.1048 0.1063 0.0857 0.0803 0.0754 0.0711 0.1548 0.1477 0.142 0.1383 0.1057 0.0989 0.0929 0.0876 0.1667 0.199 0.1991 0.1894 0.1374 0.1285 0.1207 0.1138 0.0332 0.1095 0.2079 0.2397 0.1932 0.1812 0.1706 0.1613 -0.0611 -0.0141 0.0875 0.1737 0.272 0.2602 0.2484 0.2372 -0.1084 -0.0678 0.0176 0.1008 0.3135 0.3089 0.3009 0.2915 -0.1642 -0.1231 -0.0423 0.035 0.3355 0.3459 0.3475 0.3443


