

Below are three Bloomberg yield tables for a Fannie Mae 30-year MBS under three different prices...
Fantastic news! We've Found the answer you've been seeking!
Question:
Transcribed Image Text:
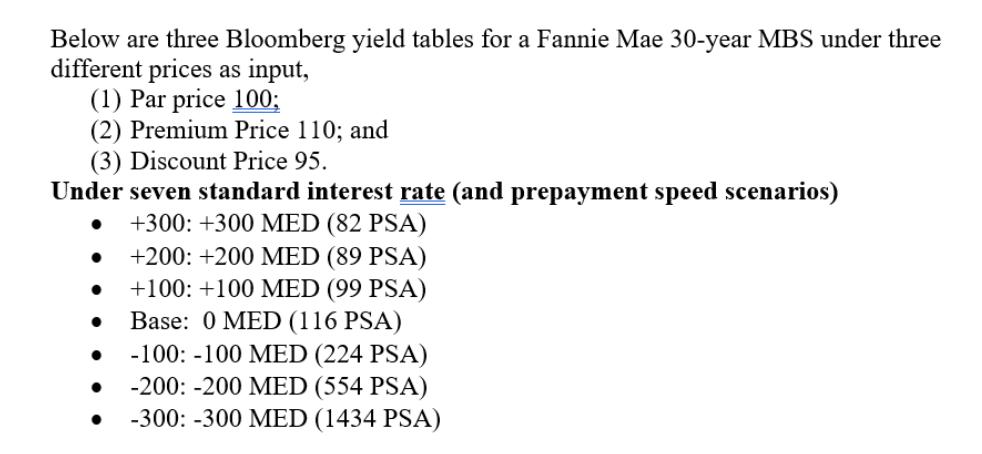
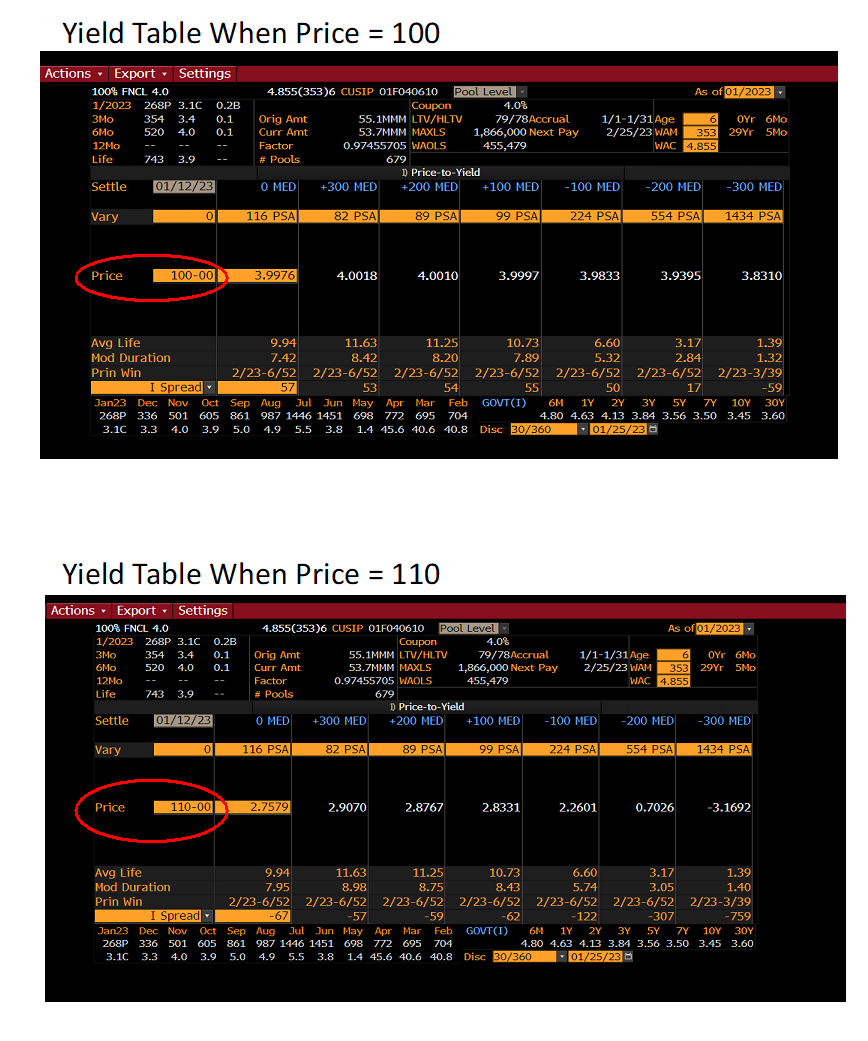
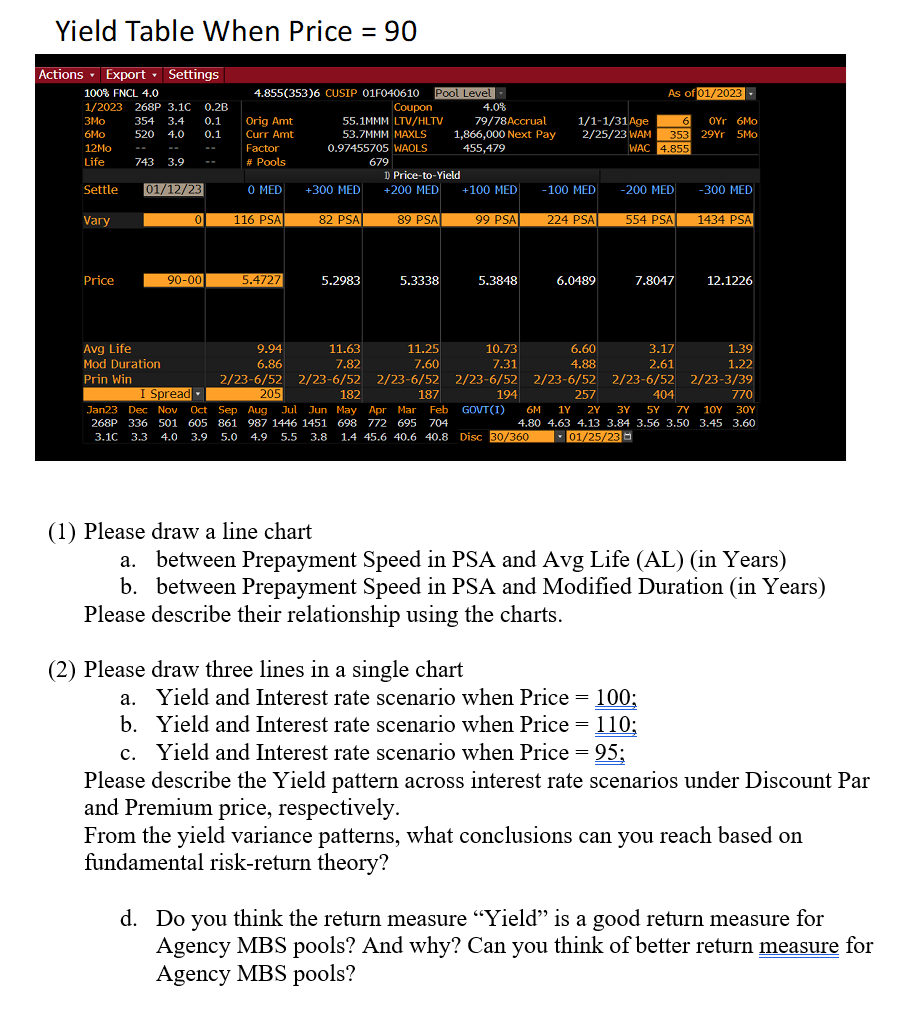
Below are three Bloomberg yield tables for a Fannie Mae 30-year MBS under three different prices as input, (1) Par price 100; (2) Premium Price 110; and (3) Discount Price 95. Under seven standard interest rate (and prepayment speed scenarios) +300: +300 MED (82 PSA) +200: +200 MED (89 PSA) +100: +100 MED (99 PSA) Base: 0 MED (116 PSA) -100: -100 MED (224 PSA) -200: -200 MED (554 PSA) -300: -300 MED (1434 PSA) Yield Table When Price = 100 Actions Export Settings 100% FNCL 4.0 1/2023 268P 3.1 0.2B 354 3.4 0.1 520 4.0 0.1 3Mo 6Mo 12Mo Life Settle Vary Price 3Mo 6Mo -- Avg Life Mod Duration Prin Win 12Mo Life Settle Vary 743 3.9 Price -- 01/12/23 100-00 0 -- 743 3.9 Avg Life Mod Duration Prin Win Y 01/12/23 -- 0 110-00 4.855(353)6 CUSIP 01F040610 Pool Level Coupon Orig Amt Curr Amt 55.1MMM LTV/HLTV 53.7MMM MAXLS 0.97455705 WAOLS 679 Factor # Pools -- O MED 116 PSA 3.9976 Yield Table When Price = 110 Actions Export Settings 100% FNCL 4.0 1/2023 268P 3.10 0.2B 354 3.4 0.1 520 4.0 0.1 9.94 7.42 2/23-6/52 I Spread 57 53 54 Jan23 Dec Nov Oct Sep Aug Jul Jun May Apr Mar Feb 268P 336 501 605 861 1446 1451 861 987 1446 1451 698 772 695 704 3.1C 3.3 4.0 3.9 5.0 987 4.9 5.5 3.8 1.4 45.6 40.6 40.8 1.4 45.6 40.6 40.8 Disc 30/360 Orig Amt Curr Amt Factor # Pools +300 MED O MED 82 PSA 116 PSA 4.0018 2.7579 11.63 8.42 2/23-6/52 2/23-6/52 D) Price-to-Yield +200 MED 89 PSA 4.0010 +300 MED 11.25 8.20 4.855(353)6 CUSIP 01F040610 Pool Level 82 PSA 2.9070 Coupon 55.1MMM LTV/HLTV 53.7MMM MAXLS 0.97455705 WAOLS 679 4.0% 79/78Accrual 1,866,000 Next Pay 455,479 1) Price-to-Yield +200 MED 89 PSA +100 MED 2.8767 99 PSA 3.9997 4.0% 79/78Accrual 1,866,000 Next Pay 455,479 +100 MED 99 PSA 2.8331 -100 MED 224 PSA 1/1-1/31Age 2/25/23 WAM 3.9833 -100 MED 224 PSA 10.73 6.60 3.17 1.39 2.84 7.89 5.32 1.32 2/23-6/52 2/23-6/52 2/23-6/52 2/23-3/39 55 50 17 -59 GOVT (1) 6M 1Y 2Y 3Y 5Y 74 10Y 30Y 4.80 4.63 4.13 3.84 3.56 3.50 3.45 3.60 01/25/23 2.2601 WAC 4.855 As of 01/2023 -200 MED 6 OYr 6Mo 353 29Yr 5Mo 554 PSA 3.9395 -200 MED As of 01/2023 1/1-1/31 Age 6 0Yr 6Mo 2/25/23 WAM 353 29Yr 5Mo WAC 4.855 554 PSA 0.7026 -300 MED 1434 PSA 3.8310 -300 MED 1434 PSA -3.1692 9.94 11.63 11.25 10.73 6.60 1.39 3.17 7.95 8.98 8.75 8.43 5.74 3.05 1.40 2/23-6/52 2/23-6/52 2/23-6/52 2/23-6/52 2/23-6/52 2/23-6/52 2/23-3/39 I Spread -67 -57 -59 -62 -122 -307 -759 Jan23 Dec Nov Oct Sep Aug Jul Jun May Apr Mar Feb GOVT(I) 6M 1Y 2Y 3Y 5Y 7Y 10Y 30Y 268P 336 501 605 861 987 1446 1451 698 772 695 704 4.80 4.63 4.13 3.84 3.56 3.50 3.45 3.60 3.1C 3.3 4.0 3.9 5.0 4.9 5.5 3.8 1.4 45.6 40.6 40.8 Disc 30/360 01/25/23 Yield Table When Price = 90 Actions Export Settings 100% FNCL 4.0 1/2023 268P 3.1C 0.2B 3Mo 354 3.4 0.1 6Mo 12Mo 520 4.0 0.1 Life Settle Vary Price -- 743 3.9 01/12/23 Avg Life Mod Duration Prin Win 0 90-00 4.855(353)6 CUSIP 01F040610 Pool Level Coupon 55.1MMM LTV/HLTV 53.7MMM MAXLS 0.97455705 WAOLS Orig Amt Curr Amt Factor # Pools O MED 116 PSA 5.4727 +300 MED 82 PSA 5.2983 679 4.0% 79/78Accrual 1,866,000 Next Pay 455,479 1) Price-to-Yield +200 MED 89 PSA 5.3338 +100 MED 99 PSA 5.3848 (2) Please draw three lines in a single chart 1/1-1/31Age 2/25/23 WAM 353 WAC 4.855 -100 MED 224 PSA As of 01/2023 - 6 OYr 6Mo 29Yr 5Mo 6.0489 -200 MED 554 PSA 7.8047 -300 MED 1434 PSA 11.63 10.73 6.60 3.17 1.39 9.94 11.25 6.86 7.82 7.60 7.31 4.88 2.61 1.22 2/23-6/52 2/23-6/52 2/23-6/52 2/23-6/52 2/23-6/52 2/23-6/52 2/23-3/39 I Spread 205 182 187 194 257 404 770 Jan23 Dec Nov Oct Sep Aug Jul Jun May Apr Mar Feb GOVT(I) 6M 1Y 2Y 3Y 5Y 7Y 10Y 30Y 268P 336 501 605 861 987 1446 1451 698 772 695 704 4.80 4.63 4.13 3.84 3.56 3.50 3.45 3.60 3.1C 3.3 4.0 3.9 5.0 4.9 5.5 3.8 1.4 45.6 40.6 40.8 Disc 30/360 01/25/23 12.1226 (1) Please draw a line chart a. between Prepayment Speed in PSA and Avg Life (AL) (in Years) b. between Prepayment Speed in PSA and Modified Duration (in Years) Please describe their relationship using the charts. a. Yield and Interest rate scenario when Price = 100; b. Yield and Interest rate scenario when Price = 110; c. Yield and Interest rate scenario when Price = 95; Please describe the Yield pattern across interest rate scenarios under Discount Par and Premium price, respectively. From the yield variance patterns, what conclusions can you reach based on fundamental risk-return theory? d. Do you think the return measure "Yield" is a good return measure for Agency MBS pools? And why? Can you think of better return measure for Agency MBS pools? Below are three Bloomberg yield tables for a Fannie Mae 30-year MBS under three different prices as input, (1) Par price 100; (2) Premium Price 110; and (3) Discount Price 95. Under seven standard interest rate (and prepayment speed scenarios) +300: +300 MED (82 PSA) +200: +200 MED (89 PSA) +100: +100 MED (99 PSA) Base: 0 MED (116 PSA) -100: -100 MED (224 PSA) -200: -200 MED (554 PSA) -300: -300 MED (1434 PSA) Yield Table When Price = 100 Actions Export Settings 100% FNCL 4.0 1/2023 268P 3.1 0.2B 354 3.4 0.1 520 4.0 0.1 3Mo 6Mo 12Mo Life Settle Vary Price 3Mo 6Mo -- Avg Life Mod Duration Prin Win 12Mo Life Settle Vary 743 3.9 Price -- 01/12/23 100-00 0 -- 743 3.9 Avg Life Mod Duration Prin Win Y 01/12/23 -- 0 110-00 4.855(353)6 CUSIP 01F040610 Pool Level Coupon Orig Amt Curr Amt 55.1MMM LTV/HLTV 53.7MMM MAXLS 0.97455705 WAOLS 679 Factor # Pools -- O MED 116 PSA 3.9976 Yield Table When Price = 110 Actions Export Settings 100% FNCL 4.0 1/2023 268P 3.10 0.2B 354 3.4 0.1 520 4.0 0.1 9.94 7.42 2/23-6/52 I Spread 57 53 54 Jan23 Dec Nov Oct Sep Aug Jul Jun May Apr Mar Feb 268P 336 501 605 861 1446 1451 861 987 1446 1451 698 772 695 704 3.1C 3.3 4.0 3.9 5.0 987 4.9 5.5 3.8 1.4 45.6 40.6 40.8 1.4 45.6 40.6 40.8 Disc 30/360 Orig Amt Curr Amt Factor # Pools +300 MED O MED 82 PSA 116 PSA 4.0018 2.7579 11.63 8.42 2/23-6/52 2/23-6/52 D) Price-to-Yield +200 MED 89 PSA 4.0010 +300 MED 11.25 8.20 4.855(353)6 CUSIP 01F040610 Pool Level 82 PSA 2.9070 Coupon 55.1MMM LTV/HLTV 53.7MMM MAXLS 0.97455705 WAOLS 679 4.0% 79/78Accrual 1,866,000 Next Pay 455,479 1) Price-to-Yield +200 MED 89 PSA +100 MED 2.8767 99 PSA 3.9997 4.0% 79/78Accrual 1,866,000 Next Pay 455,479 +100 MED 99 PSA 2.8331 -100 MED 224 PSA 1/1-1/31Age 2/25/23 WAM 3.9833 -100 MED 224 PSA 10.73 6.60 3.17 1.39 2.84 7.89 5.32 1.32 2/23-6/52 2/23-6/52 2/23-6/52 2/23-3/39 55 50 17 -59 GOVT (1) 6M 1Y 2Y 3Y 5Y 74 10Y 30Y 4.80 4.63 4.13 3.84 3.56 3.50 3.45 3.60 01/25/23 2.2601 WAC 4.855 As of 01/2023 -200 MED 6 OYr 6Mo 353 29Yr 5Mo 554 PSA 3.9395 -200 MED As of 01/2023 1/1-1/31 Age 6 0Yr 6Mo 2/25/23 WAM 353 29Yr 5Mo WAC 4.855 554 PSA 0.7026 -300 MED 1434 PSA 3.8310 -300 MED 1434 PSA -3.1692 9.94 11.63 11.25 10.73 6.60 1.39 3.17 7.95 8.98 8.75 8.43 5.74 3.05 1.40 2/23-6/52 2/23-6/52 2/23-6/52 2/23-6/52 2/23-6/52 2/23-6/52 2/23-3/39 I Spread -67 -57 -59 -62 -122 -307 -759 Jan23 Dec Nov Oct Sep Aug Jul Jun May Apr Mar Feb GOVT(I) 6M 1Y 2Y 3Y 5Y 7Y 10Y 30Y 268P 336 501 605 861 987 1446 1451 698 772 695 704 4.80 4.63 4.13 3.84 3.56 3.50 3.45 3.60 3.1C 3.3 4.0 3.9 5.0 4.9 5.5 3.8 1.4 45.6 40.6 40.8 Disc 30/360 01/25/23 Yield Table When Price = 90 Actions Export Settings 100% FNCL 4.0 1/2023 268P 3.1C 0.2B 3Mo 354 3.4 0.1 6Mo 12Mo 520 4.0 0.1 Life Settle Vary Price -- 743 3.9 01/12/23 Avg Life Mod Duration Prin Win 0 90-00 4.855(353)6 CUSIP 01F040610 Pool Level Coupon 55.1MMM LTV/HLTV 53.7MMM MAXLS 0.97455705 WAOLS Orig Amt Curr Amt Factor # Pools O MED 116 PSA 5.4727 +300 MED 82 PSA 5.2983 679 4.0% 79/78Accrual 1,866,000 Next Pay 455,479 1) Price-to-Yield +200 MED 89 PSA 5.3338 +100 MED 99 PSA 5.3848 (2) Please draw three lines in a single chart 1/1-1/31Age 2/25/23 WAM 353 WAC 4.855 -100 MED 224 PSA As of 01/2023 - 6 OYr 6Mo 29Yr 5Mo 6.0489 -200 MED 554 PSA 7.8047 -300 MED 1434 PSA 11.63 10.73 6.60 3.17 1.39 9.94 11.25 6.86 7.82 7.60 7.31 4.88 2.61 1.22 2/23-6/52 2/23-6/52 2/23-6/52 2/23-6/52 2/23-6/52 2/23-6/52 2/23-3/39 I Spread 205 182 187 194 257 404 770 Jan23 Dec Nov Oct Sep Aug Jul Jun May Apr Mar Feb GOVT(I) 6M 1Y 2Y 3Y 5Y 7Y 10Y 30Y 268P 336 501 605 861 987 1446 1451 698 772 695 704 4.80 4.63 4.13 3.84 3.56 3.50 3.45 3.60 3.1C 3.3 4.0 3.9 5.0 4.9 5.5 3.8 1.4 45.6 40.6 40.8 Disc 30/360 01/25/23 12.1226 (1) Please draw a line chart a. between Prepayment Speed in PSA and Avg Life (AL) (in Years) b. between Prepayment Speed in PSA and Modified Duration (in Years) Please describe their relationship using the charts. a. Yield and Interest rate scenario when Price = 100; b. Yield and Interest rate scenario when Price = 110; c. Yield and Interest rate scenario when Price = 95; Please describe the Yield pattern across interest rate scenarios under Discount Par and Premium price, respectively. From the yield variance patterns, what conclusions can you reach based on fundamental risk-return theory? d. Do you think the return measure "Yield" is a good return measure for Agency MBS pools? And why? Can you think of better return measure for Agency MBS pools?
Expert Answer:
Answer rating: 100% (QA)
1 a The relationship between prepayment speed in PSA and average life AL in years is inverse As prepayment speed increases average life decreases High... View the full answer

Related Book For 

Posted Date:
Students also viewed these finance questions
-
Which stakeholders do you serve in your role as a clinical laboratory scientist? How can you cultivate better relationships with them?
-
The challenge of development is to improve the quality of life which calls for higher income, sustenance, self-esteem, and freedom. Critically analyze the challenges of development in China. Give...
-
Explore the ethical and regulatory considerations surrounding data privacy and security practices in database management, including compliance with frameworks such as GDPR (General Data Protection...
-
In Exercises 7192, find and simplify the difference quotient f(x +h)-f(x) h -, h = 0
-
Nonverbal communication (e.g., the use of hand gestures) is a common form of human expression. Some researchers believe it may even help people make quicker decisions. To test this belief, a team of...
-
What color results when a red and a green LED shine together?
-
A \(2 \mathrm{~cm}\)-diameter, \(19 \mathrm{~cm}\)-long tube is placed touching a pool of liquid. The end away from the liquid pool \((\mathrm{z}=0.19 \mathrm{~m})\) is in an air stream (component C)...
-
On January 1, 2007 Nelson Company leases certain property to Queens Company at an annual rental of $60,000 payable in advance at the beginning of each year for eight years. The first payment is...
-
According to LinkedIn, objective - based optimization is activated when you focus on maximum delivery and select reach or video views as an optimization goal.
-
(a) Show that the transfer function of two systems in parallel, as shown in Fig. P1.1-l(a), is equal to the sum of the transfer functions. (b) Show that the transfer function of two systems in series...
-
The accuracy of the community data used to compile the assessment list can impact the inventory of properties assessed. What can the Substantial Damage Estimator (SDE) tool NOT do?
-
Your fairy godmother is amazing in so many ways, but she needs help with her finance skills.She promised to give you $1000 a month forever.She is setting aside $100,000 today to fund this.What APR...
-
A patient has developed a fluid imbalance secondary to MDMA use which has resulted in a condition called Syndrome of Inappropriate Antidiuretic Hormone Secretion (SIADH) 1) On A concept map, start at...
-
In an epicyclic gear train, as shown in Fig.15.25, the number of teeth on wheels A, B, and C are 50, 25, and 52 respectively. If the arm rotates at 420 rpm cw, find (a) speed of wheel C when A is...
-
Why does flexibility in NoSql make it easier? What is an example.
-
1. TRUE/FALSE questions about electricity markets a. During off-peak hours, incentives to exercise market power diminish. (TRUE/FALSE) b. In a competitive electricity market, higher natural gas...
-
Company A does business with Company B. When Company A takes advantage of Company B after Company B has invested in expensive specialized assets to better meet the needs of Company A, Company A is...
-
Find the area of the surface generated by revolving the para- metric curve x = cos 1, y = sin? 1 (0 < I sa/2) about the y-axis.
-
Describe the benefits and risks entailed with an experimental approach to regression analysis.
-
Beta is a common measure of stock-market risk or volatility. It is typically estimated as the slope coefficient for a simple regression model in which stock returns over time are the dependent Y...
-
Do equal distances along a given production process ray in a linear programming problem always represent an identical level of output?
-
Provide journal entries for the following transactions for the Turner Company: May 2Sold \($40,000\) of merchandise on account May 17 Collected \($35,000\) of the May 2nd sale May 31 Estimated...
-
Knox Instruments, Inc., is a manufacturer of various medical and dental instruments. Financial statement data for the firm follow: Required a. Using the given data, calculate the nine financial...
-
Taylor Company estimates three percent of its \($600,000\) credit sales will prove uncollectible. What journal entry will Taylor Company use to record this estimate?

Study smarter with the SolutionInn App