Question
Below I have analyzed the last 24 months of Hoover's carrier transactions. Service, price, and quality. See below my analysis and I only need help
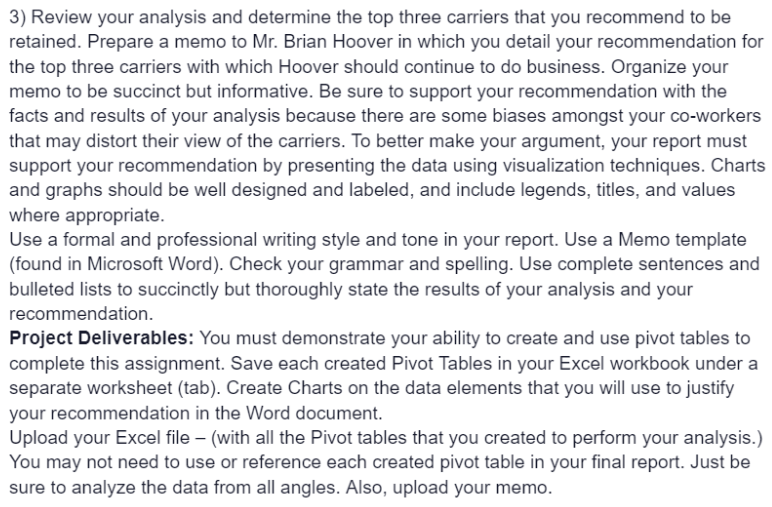
Below I have analyzed the last 24 months of Hoover's carrier transactions. Service, price, and quality. See below my analysis and I only need help with question #3.
2) Apply what you learned about the use of Excel Pivot Tables and do a thorough analysis of the data to determine which carriers provide the best service at the best price to the states that Hoover services. Consider whether you should look at totals or averages in your analysis. Slice and Dice (pivot) the data in a number of different ways to help you in your analysis. Look at each factor - service, price, and quality. Spend some time thinking about the problem and how best to analyze the data.


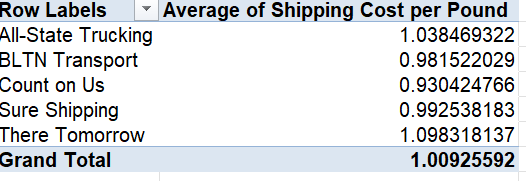
Row Labels Average of Shipping Cost per Pound All-State Trucking BLTN Transport Count on Us Sure Shipping There Tomorrow Grand Total 1.038469322 0.981522029 0.930424766 0.992538183 1.098318137 1.00925592
Step by Step Solution
There are 3 Steps involved in it
Step: 1

Get Instant Access to Expert-Tailored Solutions
See step-by-step solutions with expert insights and AI powered tools for academic success
Step: 2

Step: 3

Ace Your Homework with AI
Get the answers you need in no time with our AI-driven, step-by-step assistance
Get Started


