

Question
Below is a Bland Altman Plot that examines the agreement between an our new Body Composition App (%Fat3C-IMAGE) and the Laboratory Criterion (%Fat4C-UWW). The average
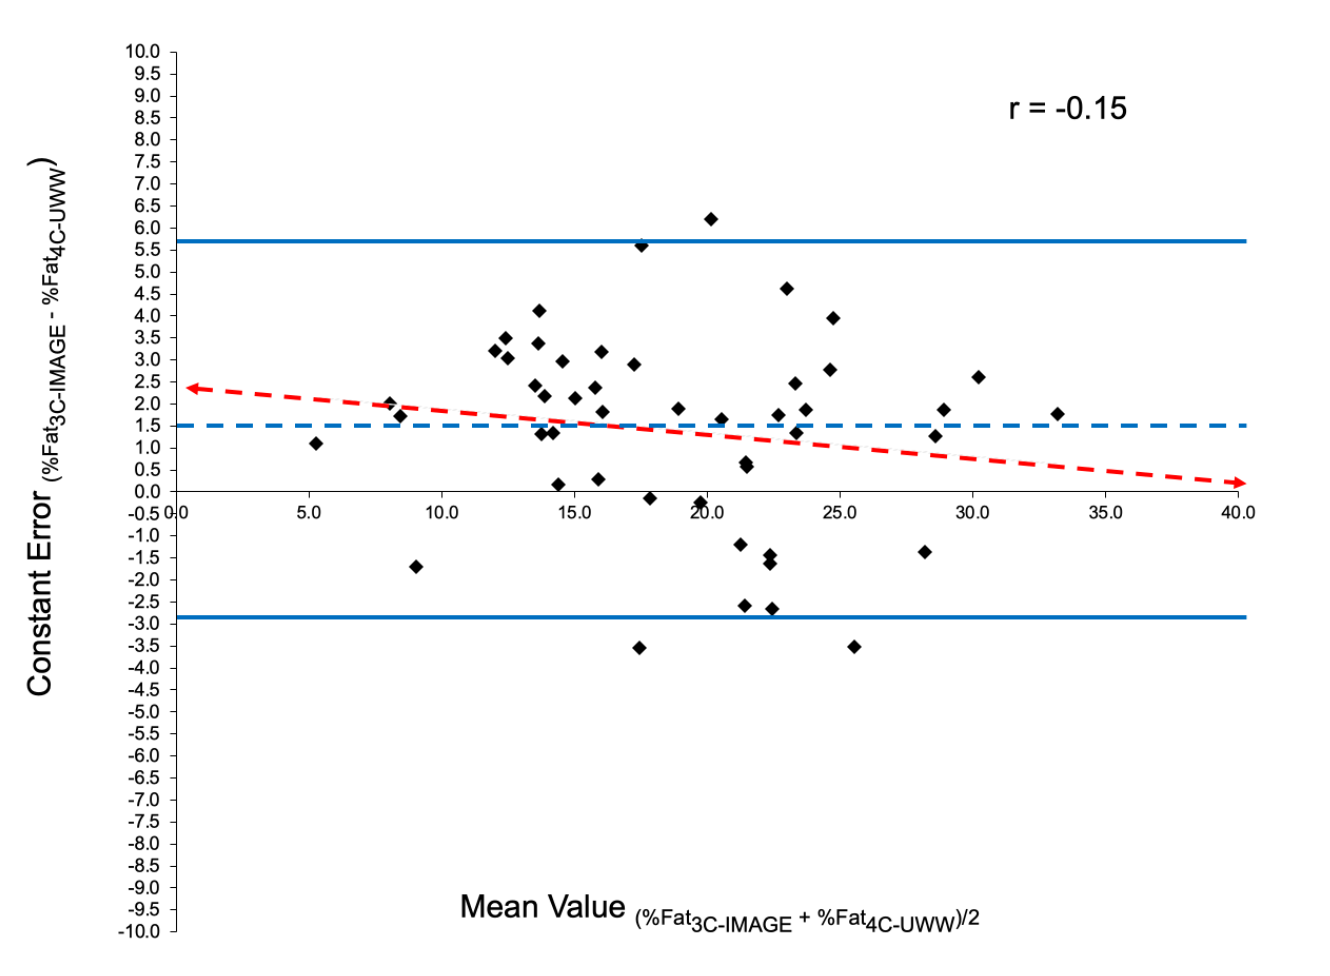
Below is a Bland Altman Plot that examines the agreement between an our new Body Composition App (%Fat3C-IMAGE) and the Laboratory Criterion (%Fat4C-UWW). The average of the 2 measures is plotted on the X axis. The difference between the two measures is plotted on the Y axis.
Given the observed correlation between the X and Y axis show in red, would we anticipate that:
a. TheBody CompositionApp(%Fat3C-IMAGE)will overestimate for adults with higher %Fat
b. The Body CompositionApp(%Fat3C-IMAGE) willunderestimate for adults with higher %Fat
c. The Body CompositionApp(%Fat3C-IMAGE)measure with equal accuracy for all adults regardless of their %Fat
Step by Step Solution
There are 3 Steps involved in it
Step: 1

Get Instant Access to Expert-Tailored Solutions
See step-by-step solutions with expert insights and AI powered tools for academic success
Step: 2

Step: 3
Ace Your Homework with AI
Get the answers you need in no time with our AI-driven, step-by-step assistance
Get Started
Algebra And Trigonometry, Enhanced
Authors: Cynthia Y Young
4th Edition
1119320860, 9781119320869