

Question
Below is a graph of a normal distribution with mean 5 and standard deviation o 3 The shaded region represents the probability of obtaining a

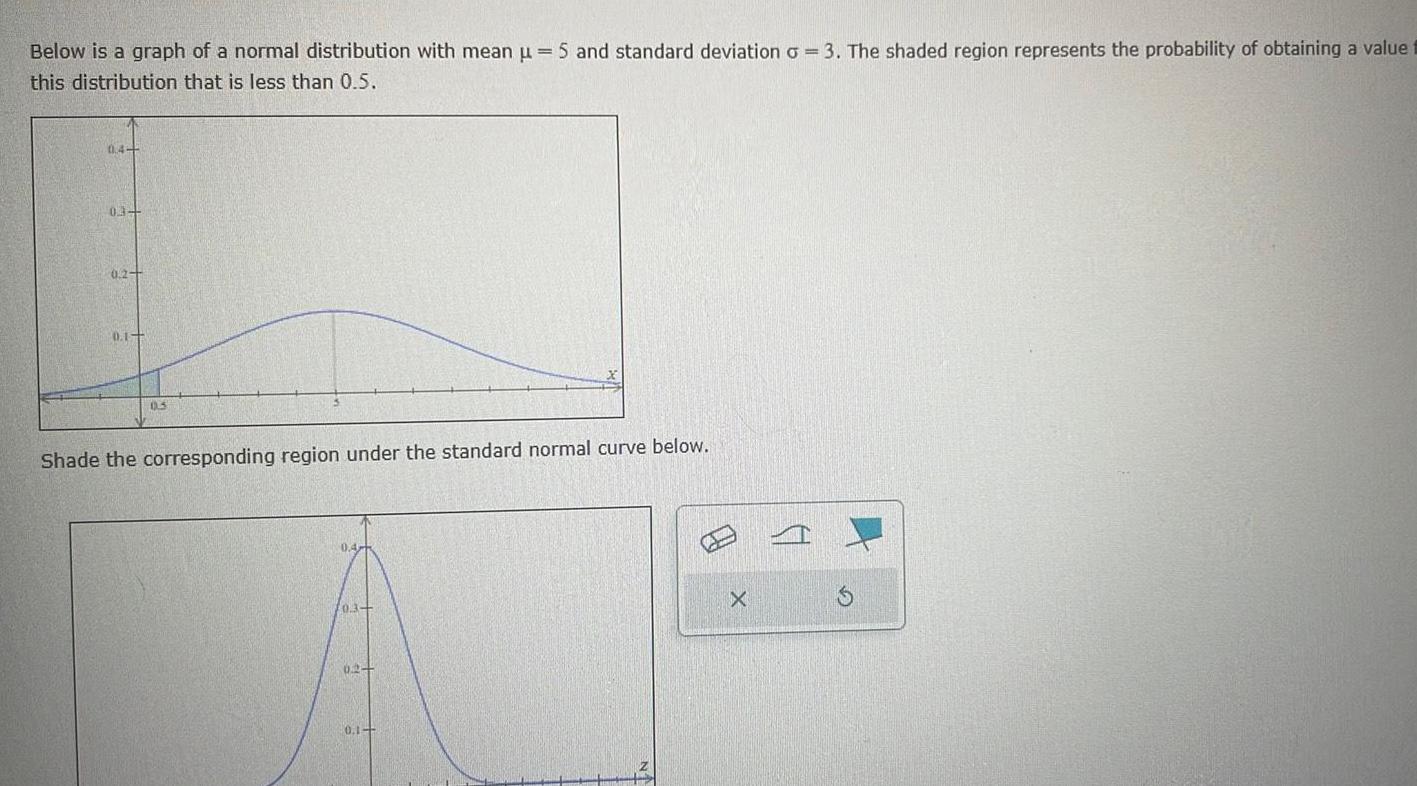
Below is a graph of a normal distribution with mean 5 and standard deviation o 3 The shaded region represents the probability of obtaining a value this distribution that is less than 0 5 0 4 03 0 2 0 1 0 5 Shade the corresponding region under the standard normal curve below 0 4 10 3 0 24 0 1 FU X
Step by Step Solution
There are 3 Steps involved in it
Step: 1

Get Instant Access to Expert-Tailored Solutions
See step-by-step solutions with expert insights and AI powered tools for academic success
Step: 2

Step: 3
Ace Your Homework with AI
Get the answers you need in no time with our AI-driven, step-by-step assistance
Get Started
CAD/CAM Systems Planning And Implementation
Authors: Charles S Knox
1st Edition
1000146383, 9781000146387