

Answered step by step
Verified Expert Solution
Question
1 Approved Answer
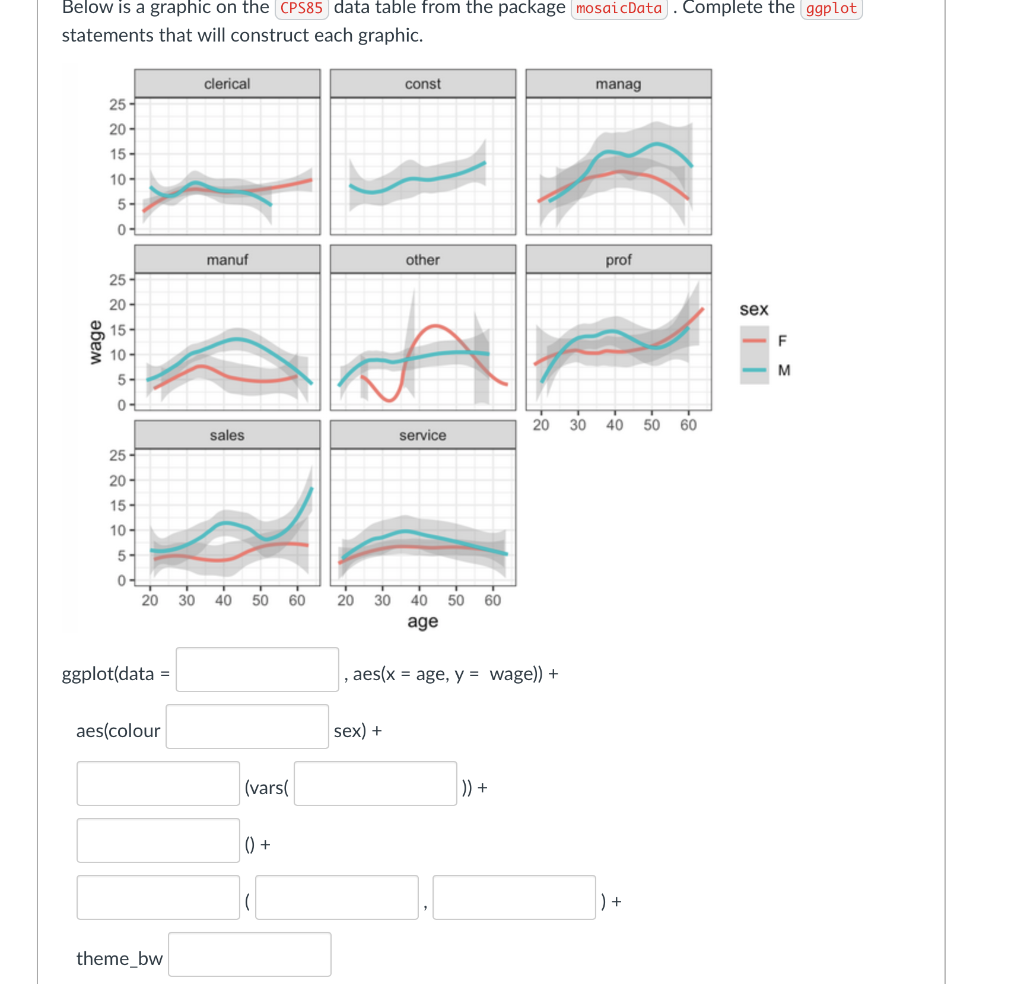
Below is a graphic on the CPS85 data table from the package mosaicData . Complete the ggplot statements that will construct each graphic. clerical const
Step by Step Solution
There are 3 Steps involved in it
Step: 1

Get Instant Access to Expert-Tailored Solutions
See step-by-step solutions with expert insights and AI powered tools for academic success
Step: 2

Step: 3
Ace Your Homework with AI
Get the answers you need in no time with our AI-driven, step-by-step assistance
Get Started
Graph Databases
Authors: Ian Robinson, Jim Webber, Emil Eifrem
1st Edition
1449356265, 978-1449356262