

Question
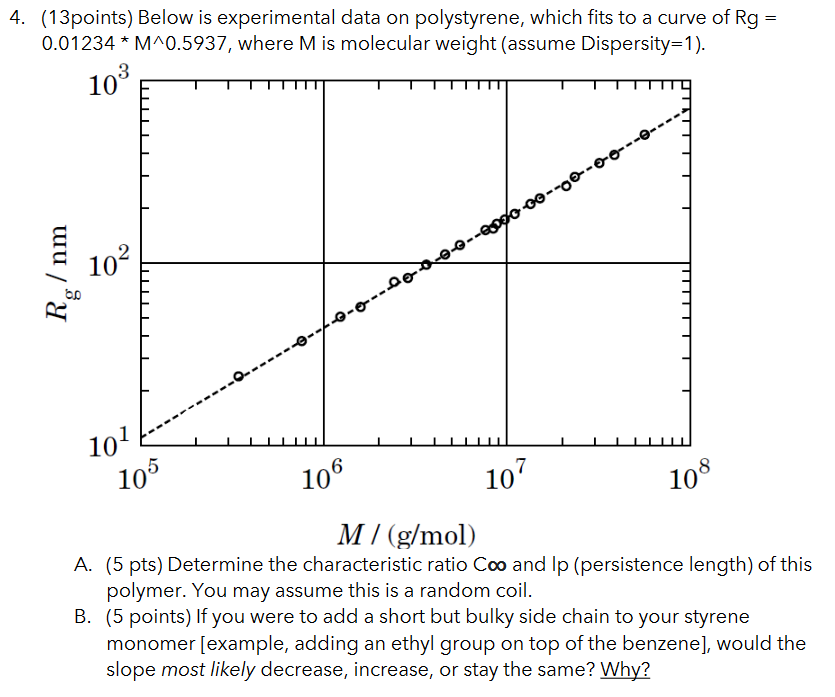
Below is experimental data on polystyrene, which fits to a curve of Rg = 0.01234 * M^0.5937, where M is molecular weight (assume Dispersity=1). A.
Below is experimental data on polystyrene, which fits to a curve of Rg = 0.01234 * M^0.5937, where M is molecular weight (assume Dispersity=1).
A. (5 pts) Determine the characteristic ratio C and lp (persistence length) of this polymer. You may assume this is a random coil.
B. (5 points) If you were to add a short but bulky side chain to your styrene monomer [example, adding an ethyl group on top of the benzene], would the slope most likely decrease, increase, or stay the same? Why?
C. (3 points) Was this measurement done on a molten polymer sample (pure polymer in liquid phase), or a sample in a solvent? Please explain your answer by using the data.
D. Bonus problem (bonus 3 points): pretend that, by changing the tacticity and other parameters, our new persistence length is 20nm. Please draw how the left-most third of the plot would change (ie, the portion of the plot from 10^5 to 10^6), and justify using theory we learned in class.
Step by Step Solution
There are 3 Steps involved in it
Step: 1

Get Instant Access to Expert-Tailored Solutions
See step-by-step solutions with expert insights and AI powered tools for academic success
Step: 2

Step: 3
Ace Your Homework with AI
Get the answers you need in no time with our AI-driven, step-by-step assistance
Get Started
Transport Processes And Separation Process Principles
Authors: Christie Geankoplis, Allen Hersel, Daniel Lepek
5th Edition
0134181026, 978-0134181028