Answered step by step
Verified Expert Solution
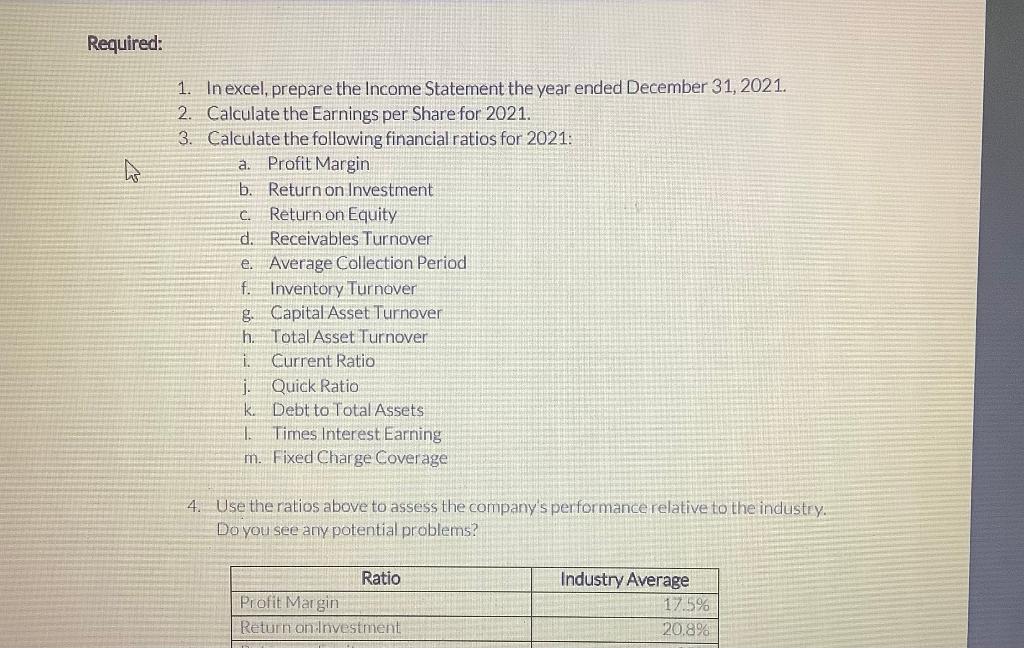
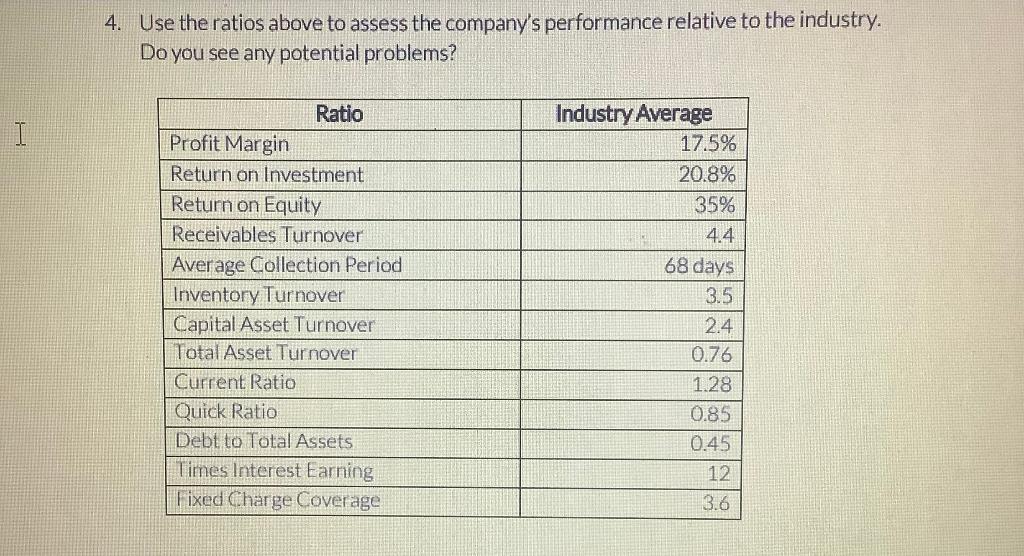
Link Copied!

Question

1 Approved Answer

Below is financial information for your organization. Balance Sheet As of Dec 31, 2021 Assets Cash AR Inventory PPE 2020 $13,000 10,000 40,000 73,000 2021

image text in transcribedimage text in transcribedimage text in transcribed

Below is financial information for your organization. Balance Sheet As of Dec 31, 2021 Assets Cash AR Inventory PPE 2020 $13,000 10,000 40,000 73,000 2021 Liabilities $15,000 AVP 22,000 N/P 30,000 Accrued Expenses 73,000 Long Terms Payable Shareholders' Equity 2020 30000 10000 3000 40,000 53,000 2021 $21,000 20,000 5,000 30,000 64,000 Total Assets $136,00 0 $140,00 Total Liabilities & Shareholders O Equity $136,00 0 $140,00 0 In 2021, your organization made total sales of $120,000, of which 80% were on credit. You incurred COGS expenses of $45,000. Selling & Admin Expenses of $20,000, Lease Expenses of $8,000, and Interest Expenses of $5,000. In addition you had to pay Taxes @25% on EBT. At the end of 2021, you had 15,000 common shares outstanding Required: w 1. In excel, prepare the Income Statement the year ended December 31, 2021. 2. Calculate the Earnings per Share for 2021. 3. Calculate the following financial ratios for 2021: a. Profit Margin b. Return on Investment C. Return on Equity d. Receivables Turnover e. Average Collection Period f. Inventory Turnover g. Capital Asset Turnover h. Total Asset Turnover 1. Current Ratio j. Quick Ratio k Debt to Total Assets 1 Times Interest Earning m. Fixed Charge Coverage 4. Use the ratios above to assess the company's performance relative to the industry. Do you see any potential problems? Ratio Profit Margin Return on Investment Industry Average 17.5% 20.8% 4. Use the ratios above to assess the company's performance relative to the industry. Do you see any potential problems? I Ratio Profit Margin Return on Investment Return on Equity Receivables Turnover Average Collection Period Inventory Turnover Capital Asset Turnover Total Asset Turnover Current Ratio Quick Ratio Debt to Total Assets Times Interest Earning Fixed Charge Coverage Industry Average 17.5% 20.8% 35% 4.4 68 days 3.5 2.4 0.76 1.28 0.85 0.45 12 3.6

Step by Step Solution

There are 3 Steps involved in it

Step: 1

blur-text-image

Get Instant Access to Expert-Tailored Solutions

See step-by-step solutions with expert insights and AI powered tools for academic success

Step: 2

blur-text-image

Step: 3

blur-text-image

Ace Your Homework with AI

Get the answers you need in no time with our AI-driven, step-by-step assistance

Get Started

Recommended Textbook for

Personal Finance

Authors: Jack R. Kapoor, Les R. Dlabay, Robert J. Hughes, Melissa Hart

12th edition

1259720683, 978-1259720680

More Books

Students also viewed these Finance questions

Question

5. Exactly. Rationale:

Answered: 1 week ago