

Question
Below is presented table of data for cost of goods sold and ending inventory for the first six months of 2012 for Wynn Manufacturing, Inc.
 Below is presented table of data for cost of goods sold and ending inventory for the first six months of 2012 for Wynn Manufacturing, Inc.
DEC JAN FEB MAR APR MAY JUNE___________ Cost of goods sold 1000 1500 2100 2700 3500 4800 Ending Inventory_________________300 _ 450 630 810 _ 1050__1440____________
You may assume that each month has 30 days
a. Calculate the number of days of cost of goods sold held in inventory for March, April, May, and June assuming quarterly cost of goods sold is used to calculate average daily costs of goods sold.
b. Discuss your findings in part a. What is happening with the firm's investment in inventory?
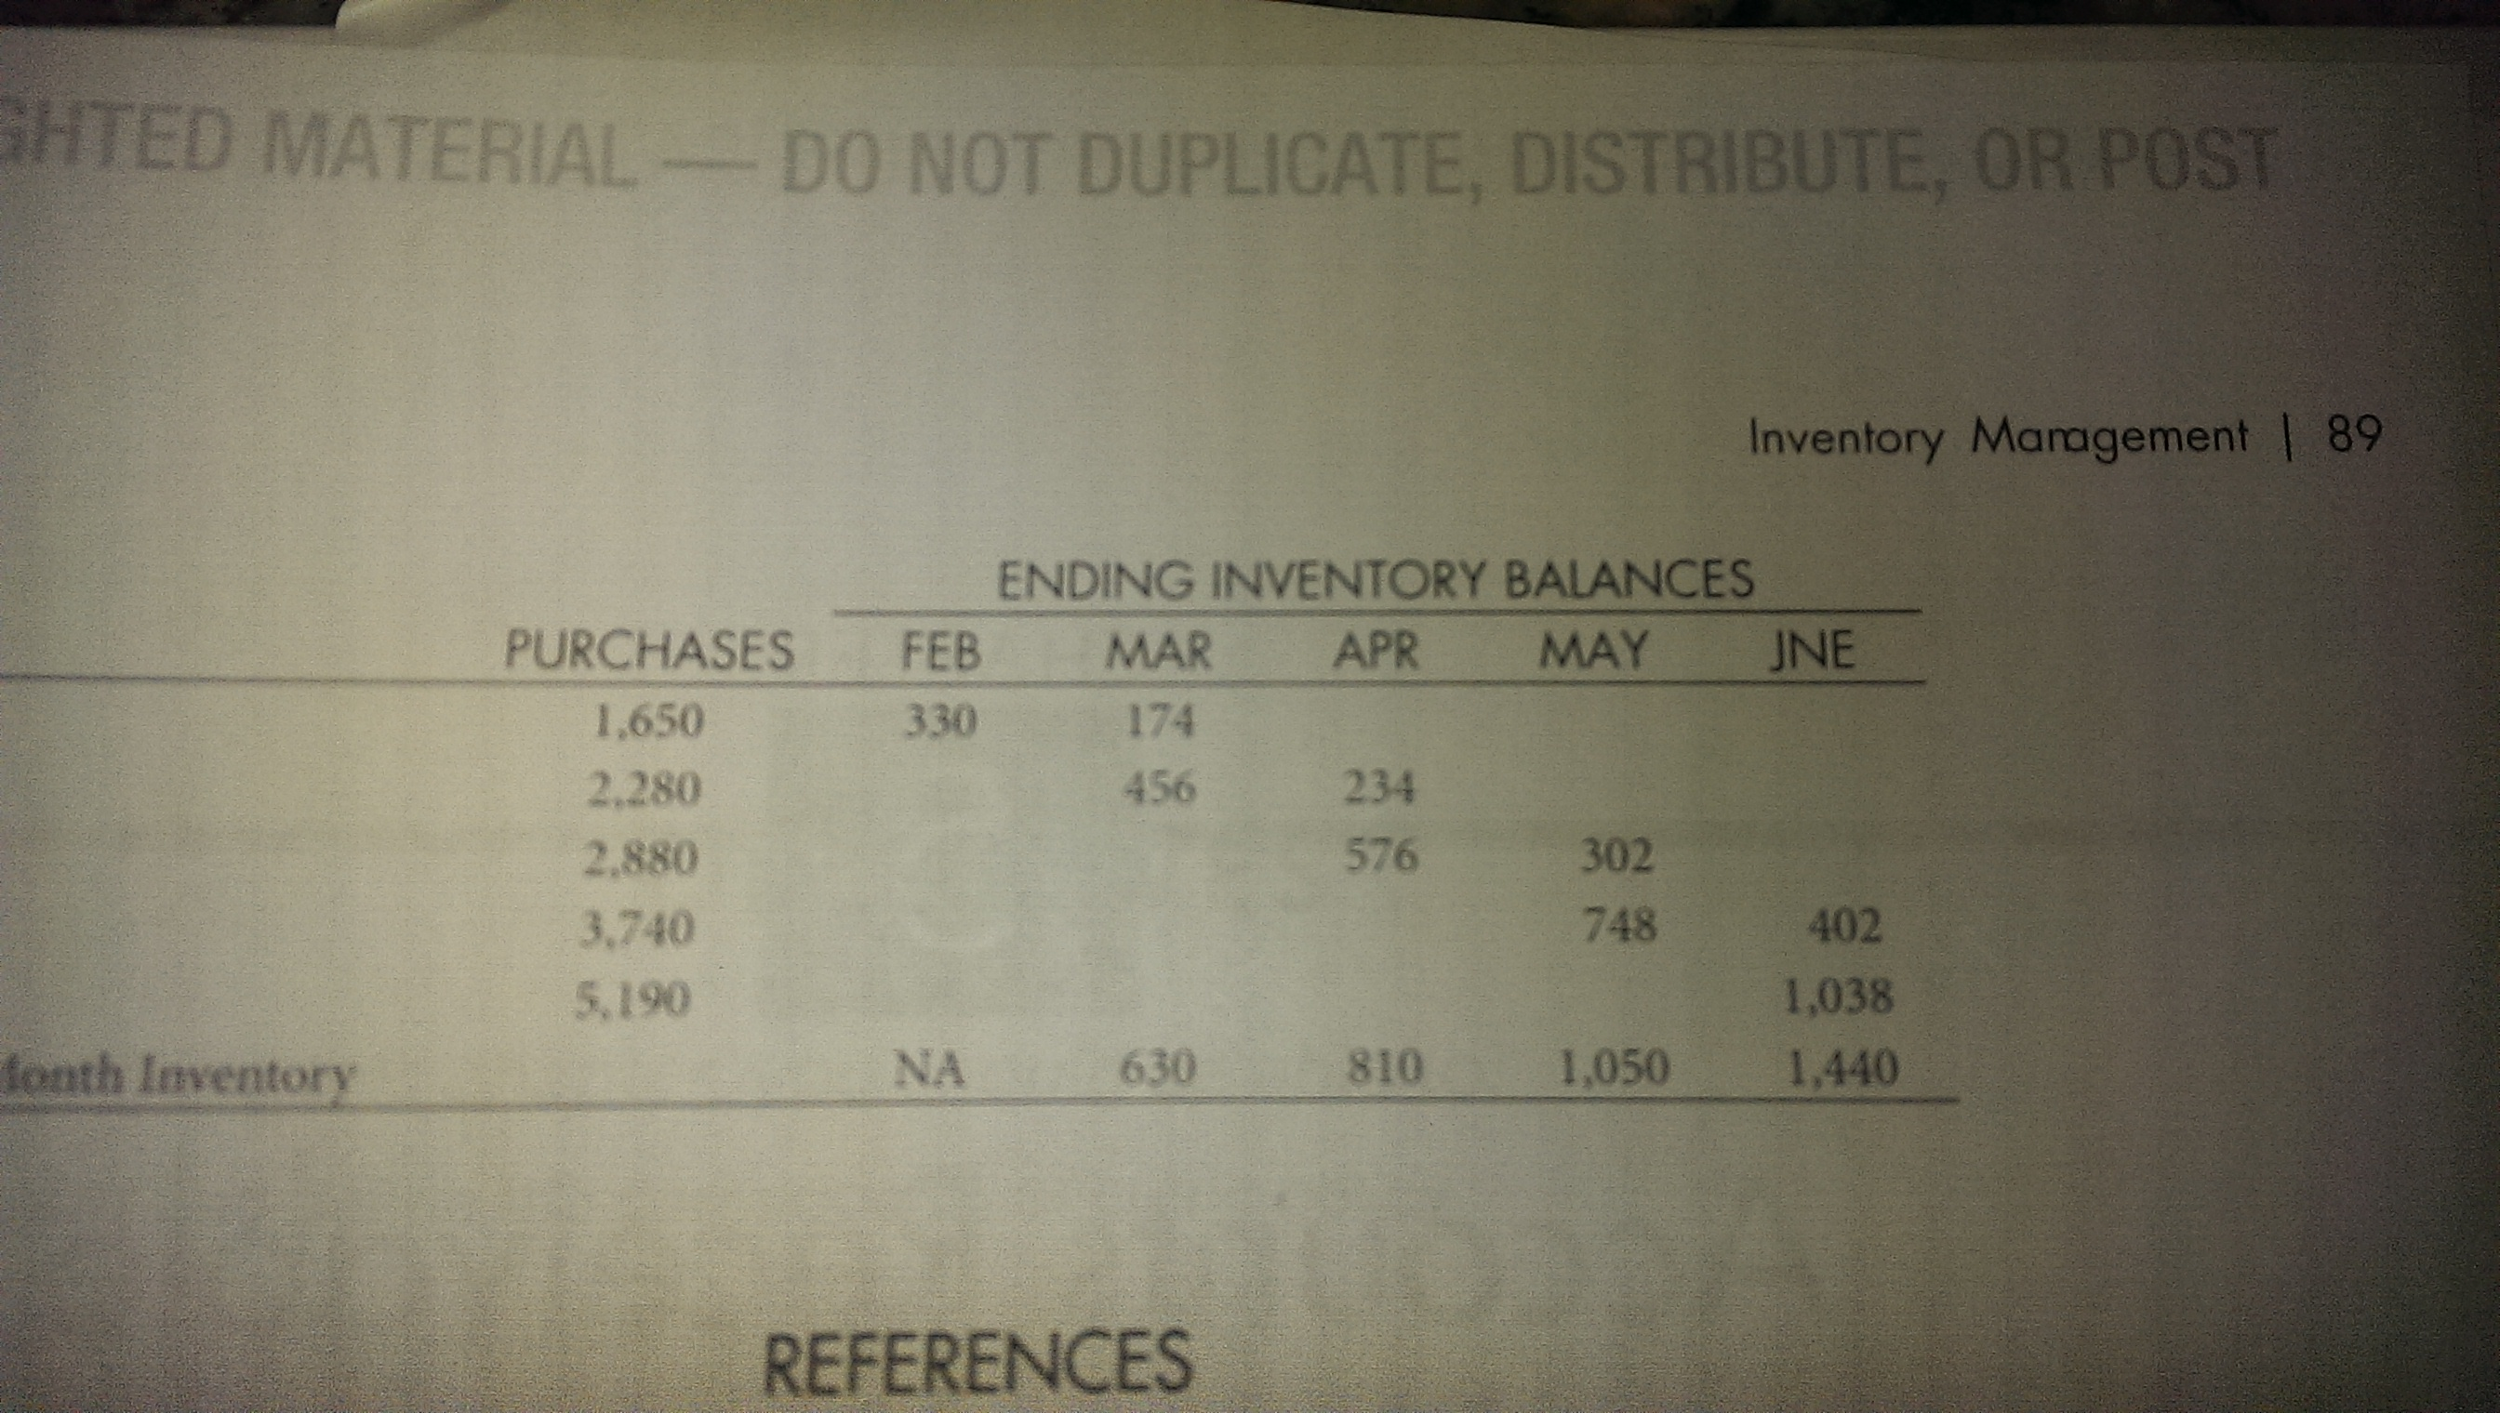
c. Below is a purchasing schedule and a schedule showing the dollar amount of those purchases remaining as an inventory balance for successive months. Calculate a balance fraction matrix and discuss what it shows about the firm's management of its inventory balance. ENDING INVENTORY BALANCES ______________________PURCHASES_____FEB____MAR___APR____MAY____JUNE_
Feb 1650 330 174
Mar 2280 456 234
Apr 2880 576 302
May 3740 748 402
June 5190 1038
End of Month Inventory NA 630 810 1050 1440_
Step by Step Solution
There are 3 Steps involved in it
Step: 1

Get Instant Access to Expert-Tailored Solutions
See step-by-step solutions with expert insights and AI powered tools for academic success
Step: 2

Step: 3
Ace Your Homework with AI
Get the answers you need in no time with our AI-driven, step-by-step assistance
Get Started
Finance At 40 Financial Intelligence
Authors: MOIRA O'NEILL Moira O'Neill
1st Edition
1408101114, 978-1408101117