

Answered step by step
Verified Expert Solution
Question
1 Approved Answer
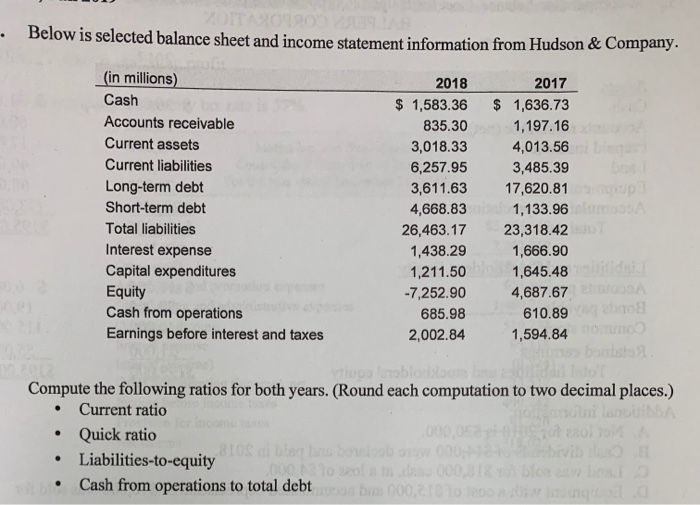
- Below is selected balance sheet and income statement information from Hudson & Company. (in millions) Cash Accounts receivable Current assets Current liabilities Long-term debt
Step by Step Solution
There are 3 Steps involved in it
Step: 1

Get Instant Access to Expert-Tailored Solutions
See step-by-step solutions with expert insights and AI powered tools for academic success
Step: 2

Step: 3
Ace Your Homework with AI
Get the answers you need in no time with our AI-driven, step-by-step assistance
Get Started
Simple Tools And Techniques For Enterprise Risk Management
Authors: Robert J. Chapman
1st Edition
1119989973, 978-1119989974