

Answered step by step
Verified Expert Solution
Question
1 Approved Answer
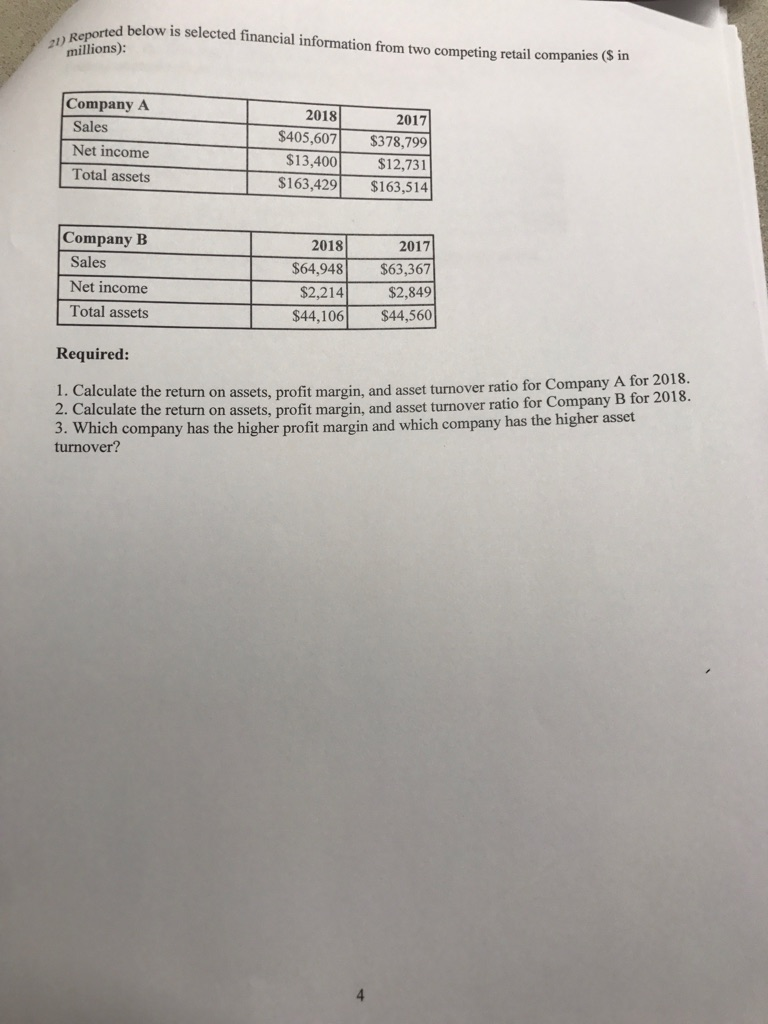
below is selected financial information from two competing retail conm millions) I companies (S in Company A 2018 Sales Net income Total assets 2017 $405,607
Step by Step Solution
There are 3 Steps involved in it
Step: 1

Get Instant Access to Expert-Tailored Solutions
See step-by-step solutions with expert insights and AI powered tools for academic success
Step: 2

Step: 3
Ace Your Homework with AI
Get the answers you need in no time with our AI-driven, step-by-step assistance
Get Started
Financial Holding Company Audit Compliance And Risk Management
Authors: Anthony Ludovic Assassa
1st Edition
6206122727, 978-6206122722