Question
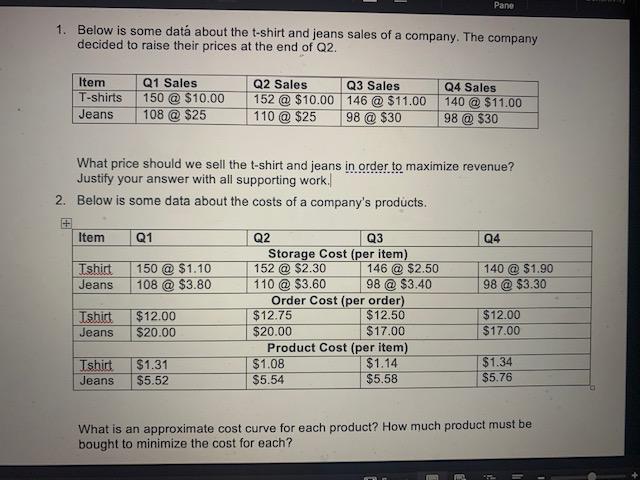
Below is some data about the t-shirt and jeans sales of a company. The company decided to raise their prices at the end of Q2.
-

 Below is some data about the t-shirt and jeans sales of a company. The company decided to raise their prices at the end of Q2.
| Item | Q1 Sales | Q2 Sales | Q3 Sales | Q4 Sales |
| T-shirts | 150 @ $10.00 | 152 @ $10.00 | 146 @ $11.00 | 140 @ $11.00 |
| Jeans | 108 @ $25 | 110 @ $25 | 98 @ $30 | 98 @ $30 |
What price should we sell the t-shirt and jeans in order to maximize revenue? Justify your answer with all supporting work.
- Below is some data about the costs of a companys products.
| Item | Q1 | Q2 | Q3 | Q4 |
| Storage Cost (per item) | ||||
| Tshirt | 150 @ $1.10 | 152 @ $2.30 | 146 @ $2.50 | 140 @ $1.90 |
| Jeans | 108 @ $3.80 | 110 @ $3.60 | 98 @ $3.40 | 98 @ $3.30 |
| Order Cost (per order) | ||||
| Tshirt | $12.00 | $12.75 | $12.50 | $12.00 |
| Jeans | $20.00 | $20.00 | $17.00 | $17.00 |
| Product Cost (per item) | ||||
| Tshirt | $1.31 | $1.08 | $1.14 | $1.34 |
| Jeans | $5.52 | $5.54 | $5.58 | $5.76 |
What is an approximate cost curve for each product? How much product must be bought to minimize the cost for each?
- Estimate the maximum profit and put forth an explanation and justification for your results.
Step by Step Solution
There are 3 Steps involved in it
Step: 1

Get Instant Access to Expert-Tailored Solutions
See step-by-step solutions with expert insights and AI powered tools for academic success
Step: 2

Step: 3

Ace Your Homework with AI
Get the answers you need in no time with our AI-driven, step-by-step assistance
Get Started


