Answered step by step
Verified Expert Solution
Question
1 Approved Answer
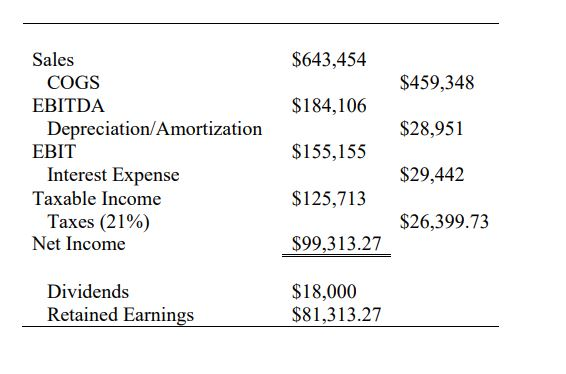
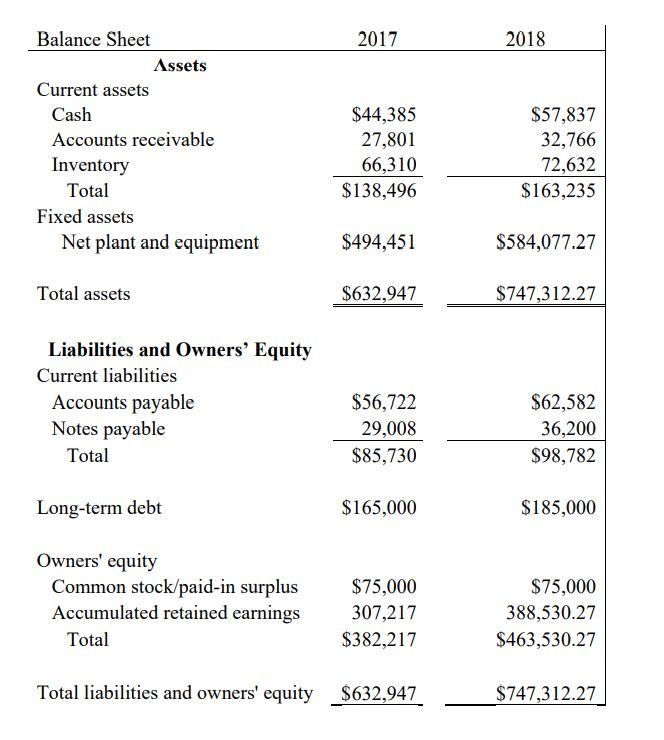
Below is the balance sheet for 2017 and 2018 and the income statement for 2018 for some company. Use the information to answer the question
Below is the balance sheet for 2017 and 2018 and the income statement for 2018 for some company. Use the information to answer the question below.


Q. What is the quick ratio in 2018? Round to the nearest 0.01
.
Note: Show all work clearly and in an organized matter. If you solve the problem with the financial calculator inputs (N, I/YR, PV, PMT, FV), then please list the value that you inputted for each.
$643,454 $459,348 $184,106 $28,951 Sales COGS EBITDA Depreciation/Amortization EBIT Interest Expense Taxable Income Taxes (21%) Net Income $155,155 $29,442 $125,713 $26,399.73 $99,313.27 Dividends Retained Earnings $18,000 $81,313.27 2017 2018 Balance Sheet Assets Current assets Cash Accounts receivable Inventory Total Fixed assets Net plant and equipment $44,385 27,801 66,310 $138,496 $57,837 32,766 72,632 $163,235 $494,451 $584,077.27 Total assets $632,947 $747,312.27 Liabilities and Owners' Equity Current liabilities Accounts payable Notes payable Total $56,722 29,008 $85,730 $62,582 36,200 $98,782 Long-term debt $165,000 $185,000 Owners' equity Common stock/paid-in surplus Accumulated retained earnings Total $75,000 307,217 $382,217 $75,000 388,530.27 $463,530.27 Total liabilities and owners' equity $632,947 $747,312.27Step by Step Solution
There are 3 Steps involved in it
Step: 1

Get Instant Access to Expert-Tailored Solutions
See step-by-step solutions with expert insights and AI powered tools for academic success
Step: 2

Step: 3

Ace Your Homework with AI
Get the answers you need in no time with our AI-driven, step-by-step assistance
Get Started


