Question: Below is the code that may be needed. Below is the code that teacher required.Necessary requirements: You must make a diagram, and then you can
Below is the code that may be needed.
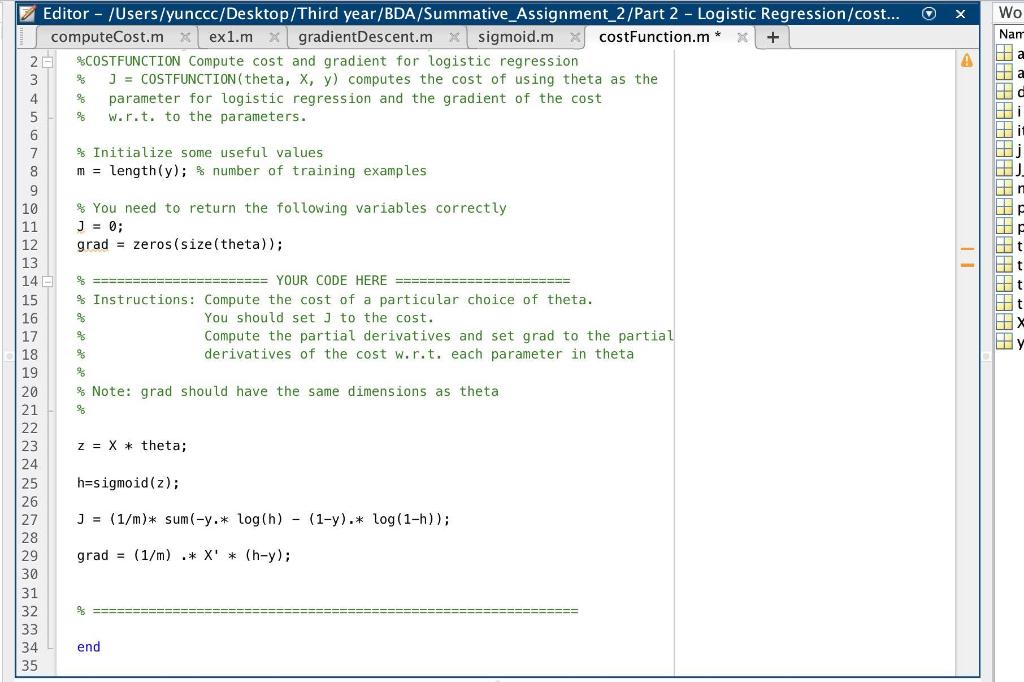
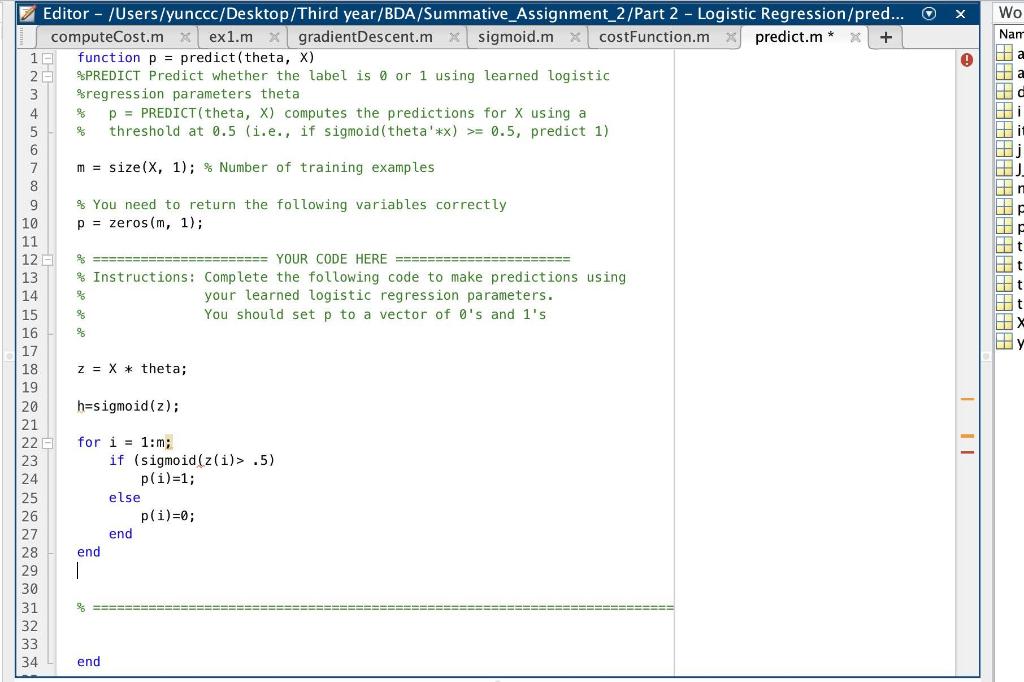
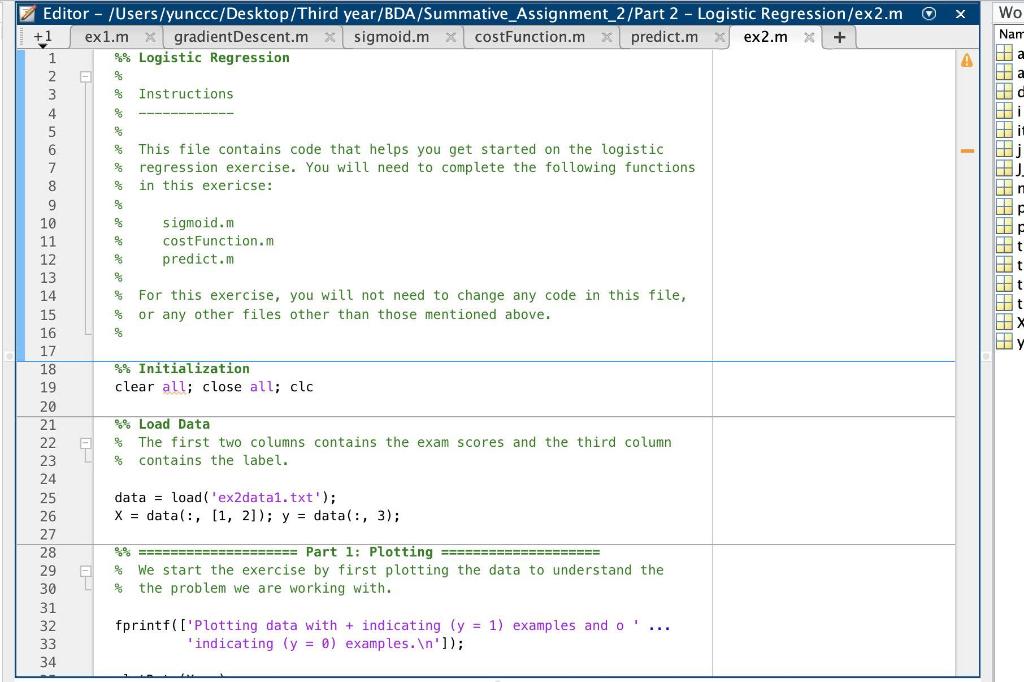
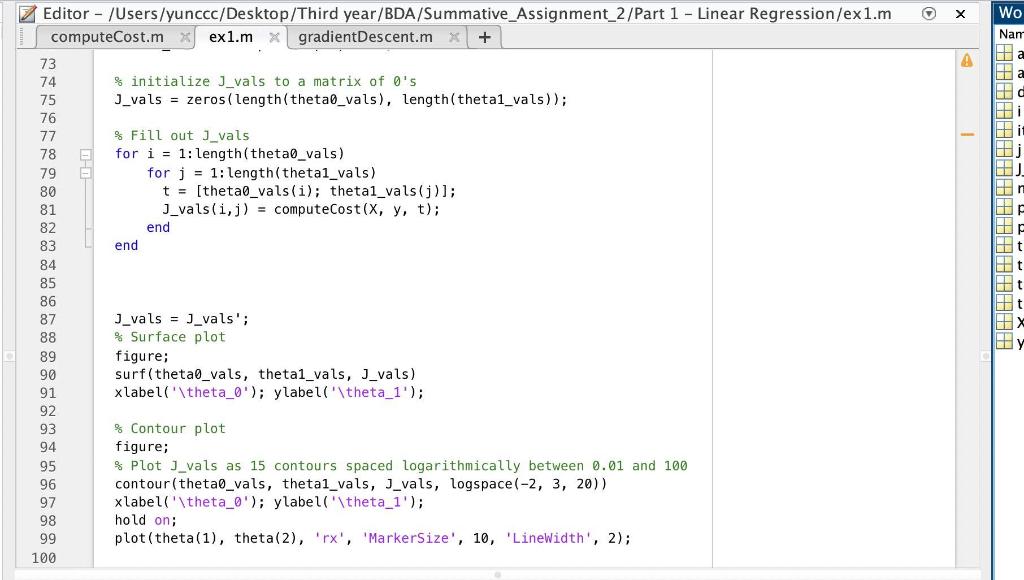
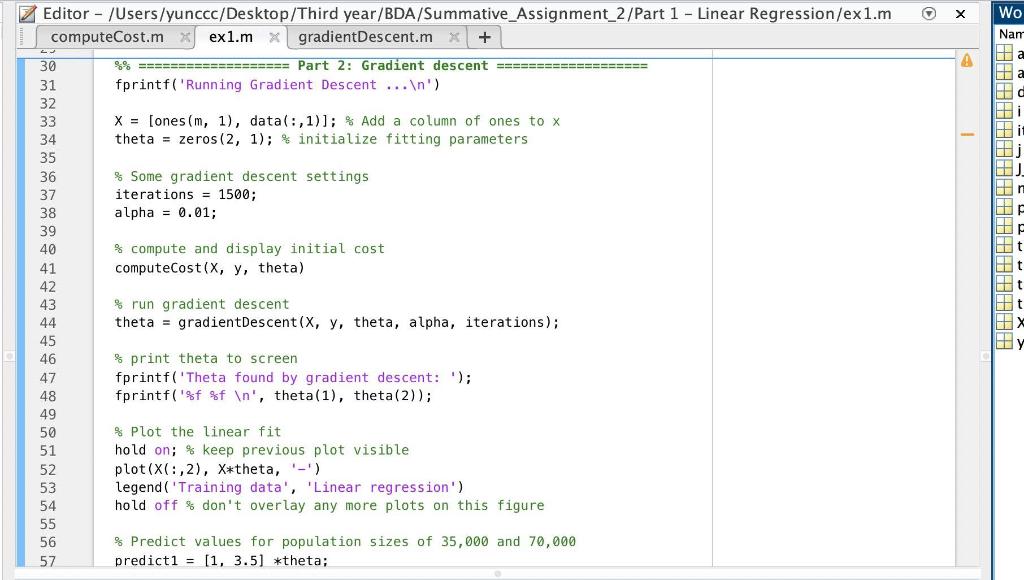
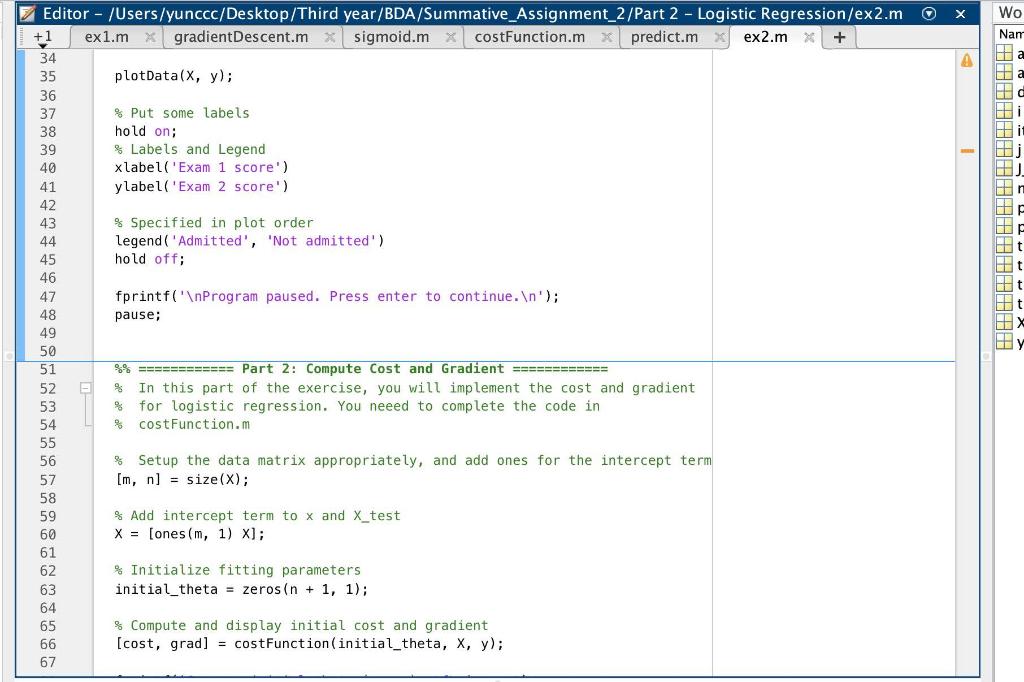
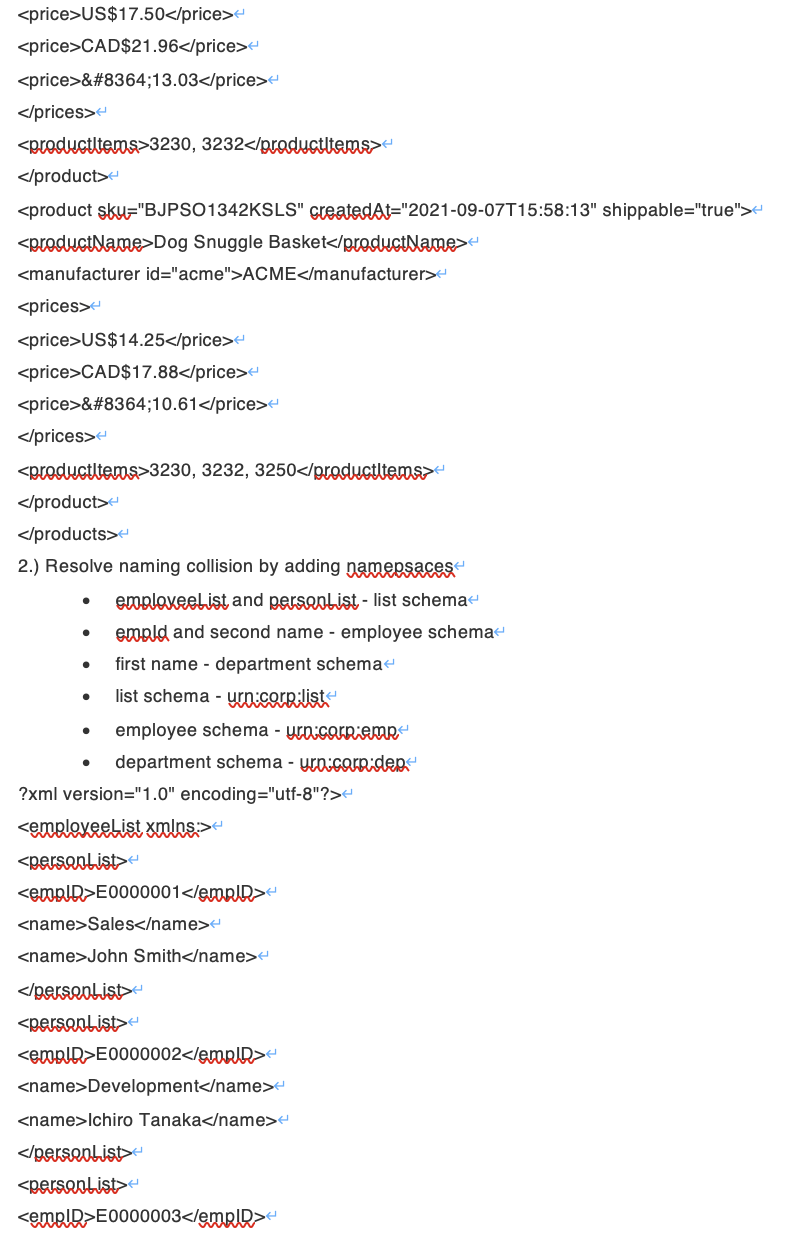
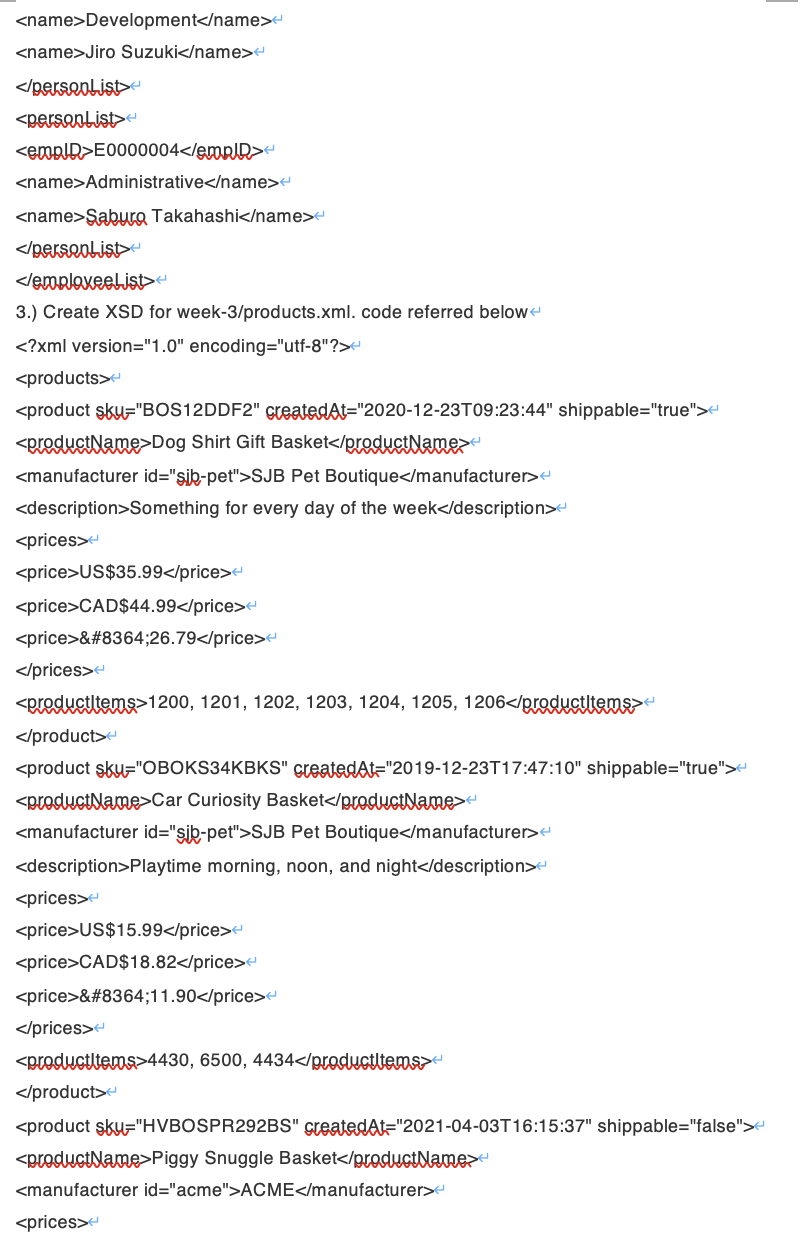
Below is the code that teacher required.Necessary requirements: You must make a diagram, and then you can use matlab to run it.DIAGRAM and MATLAB
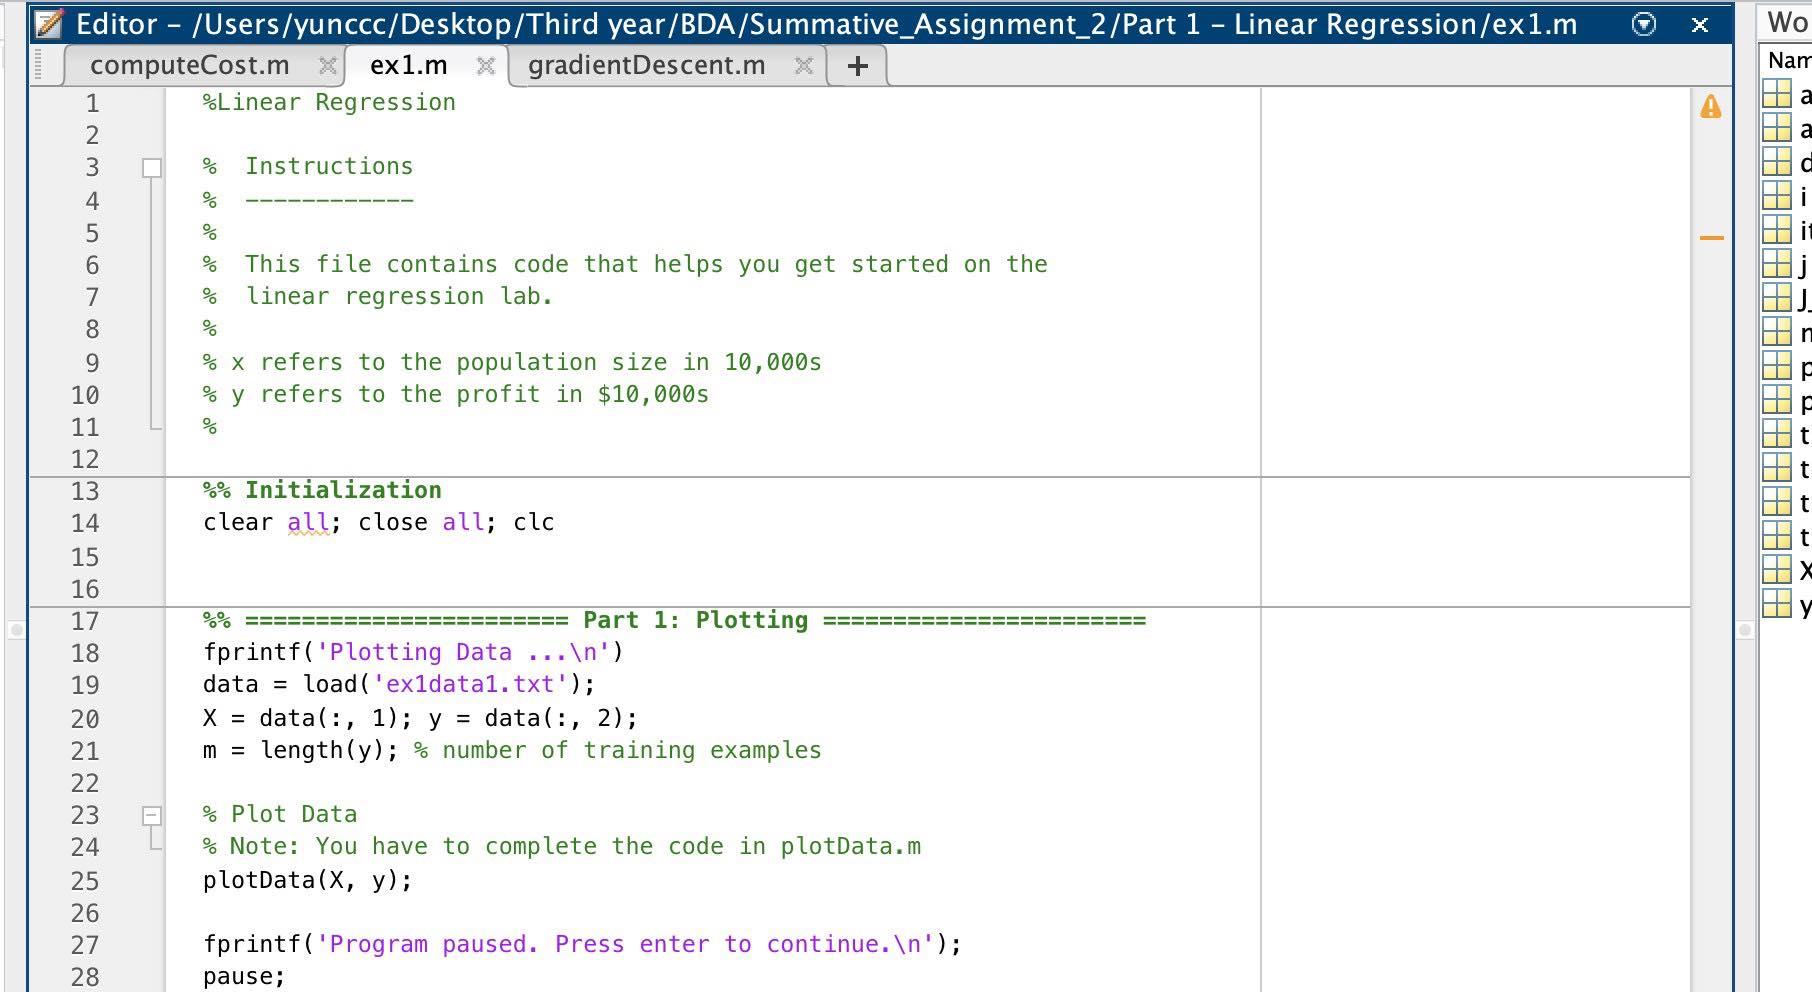
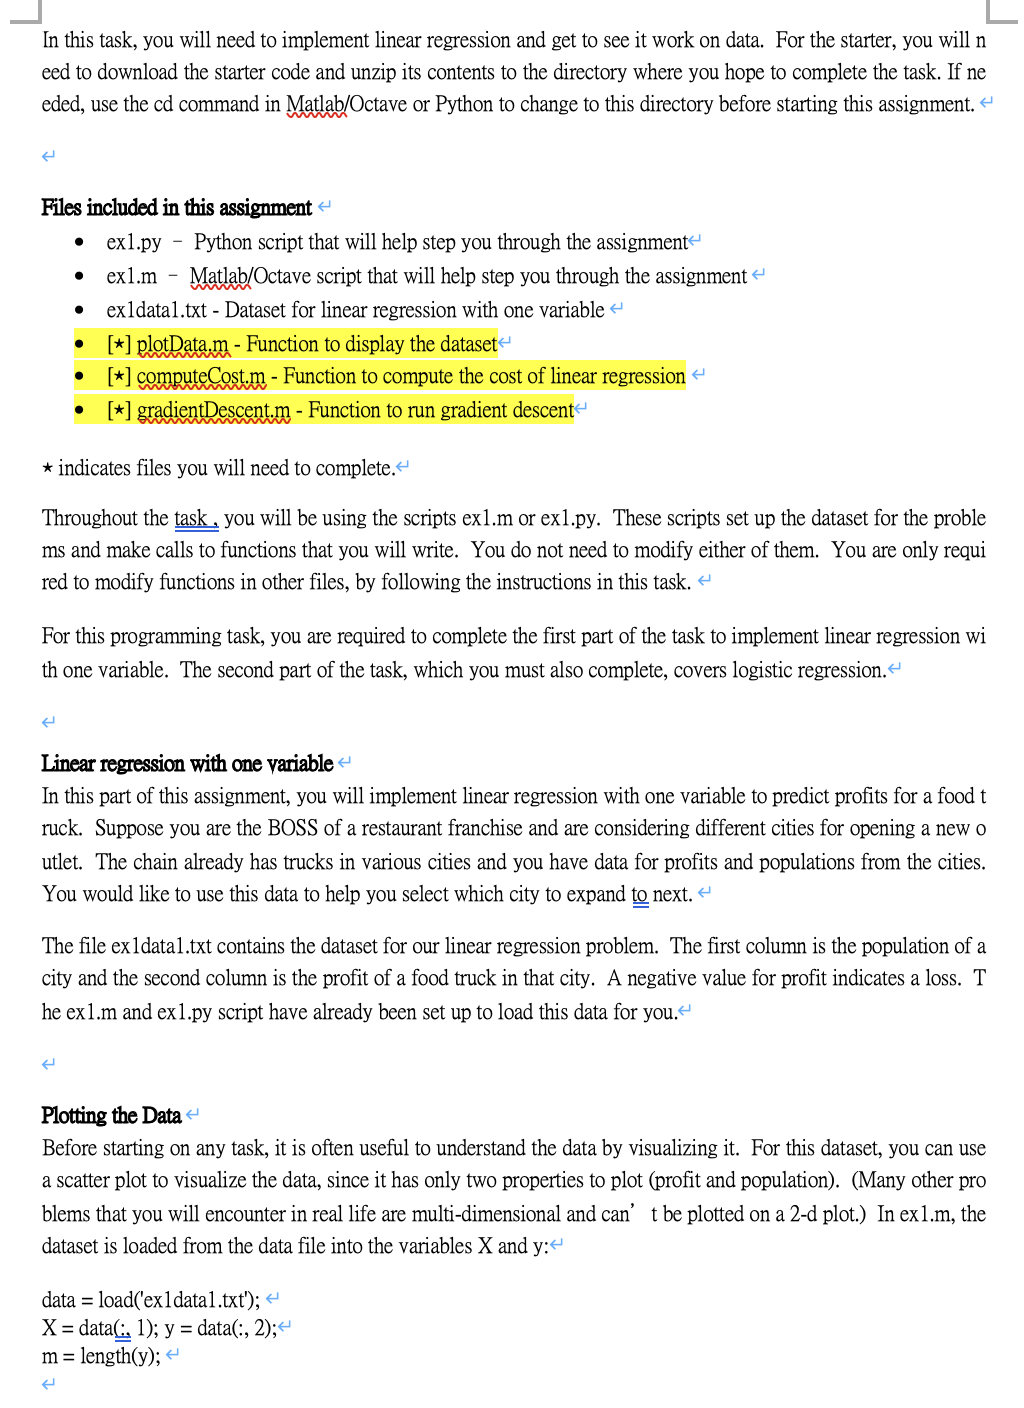
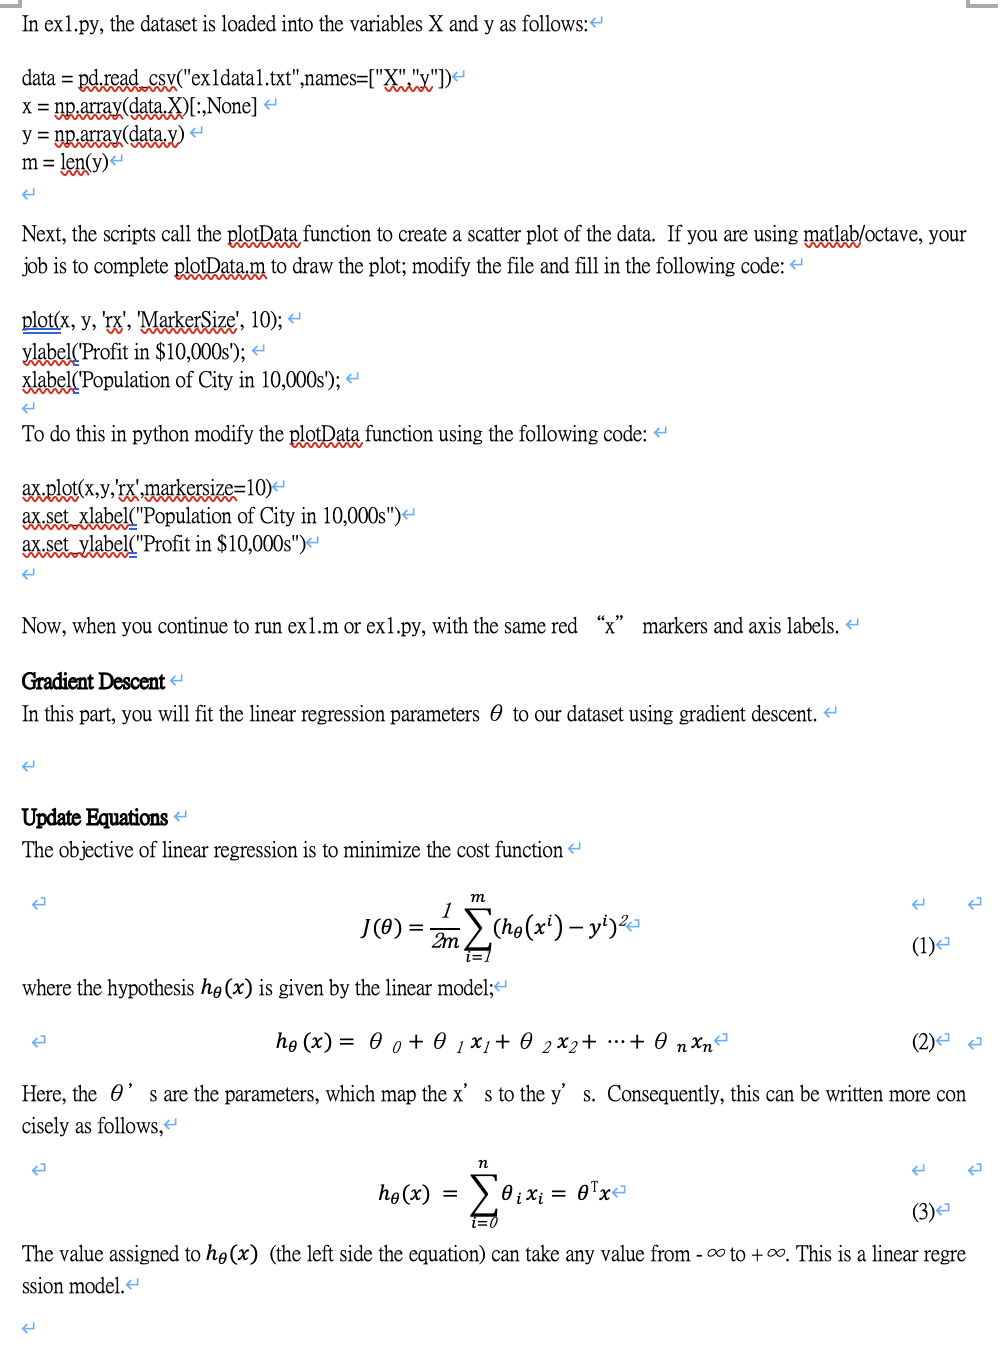
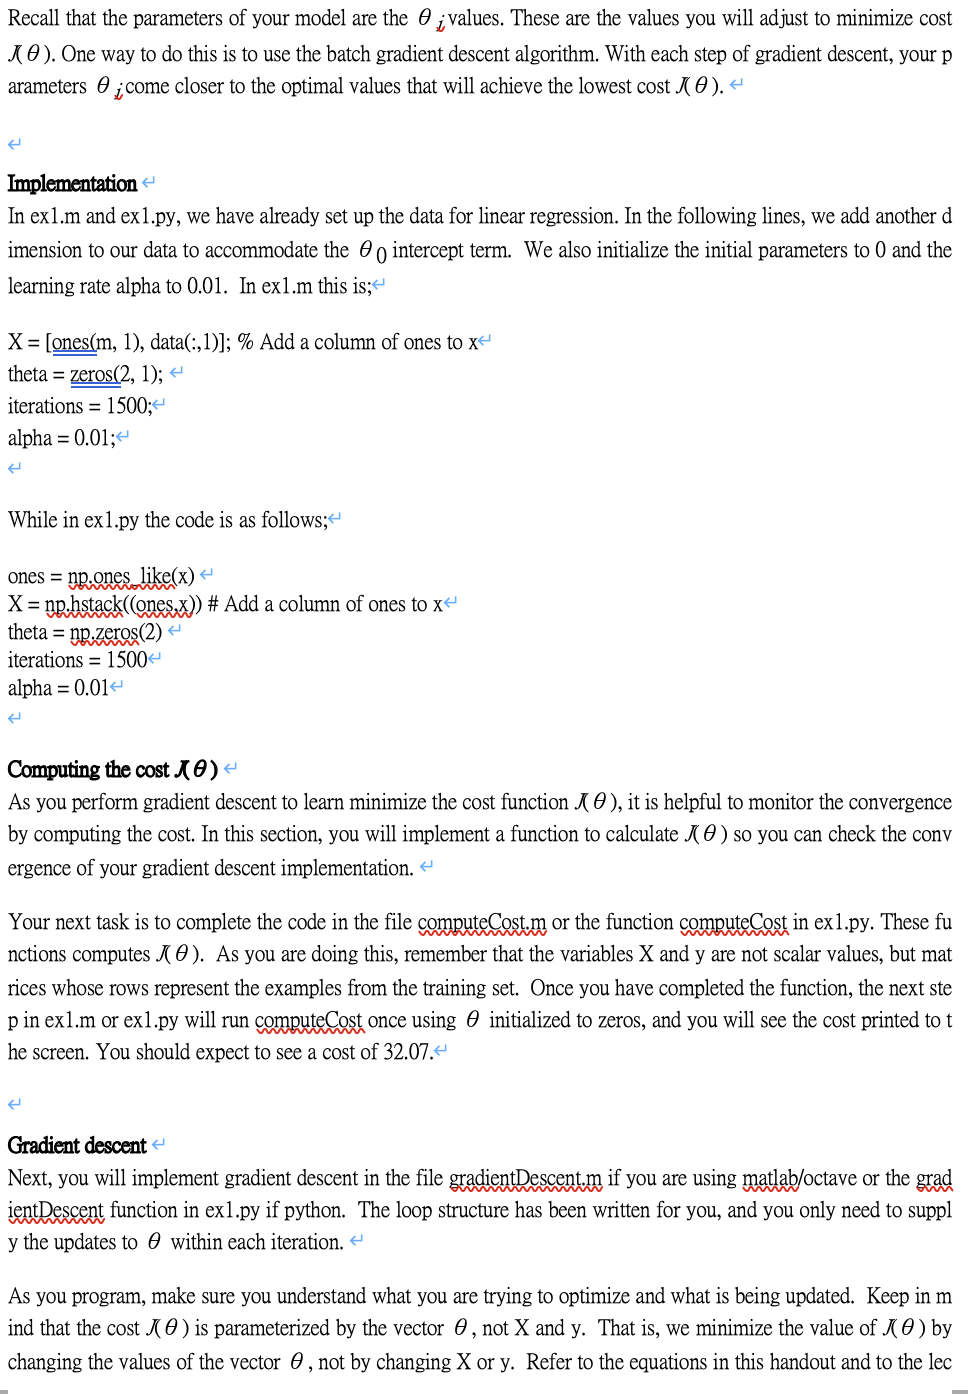
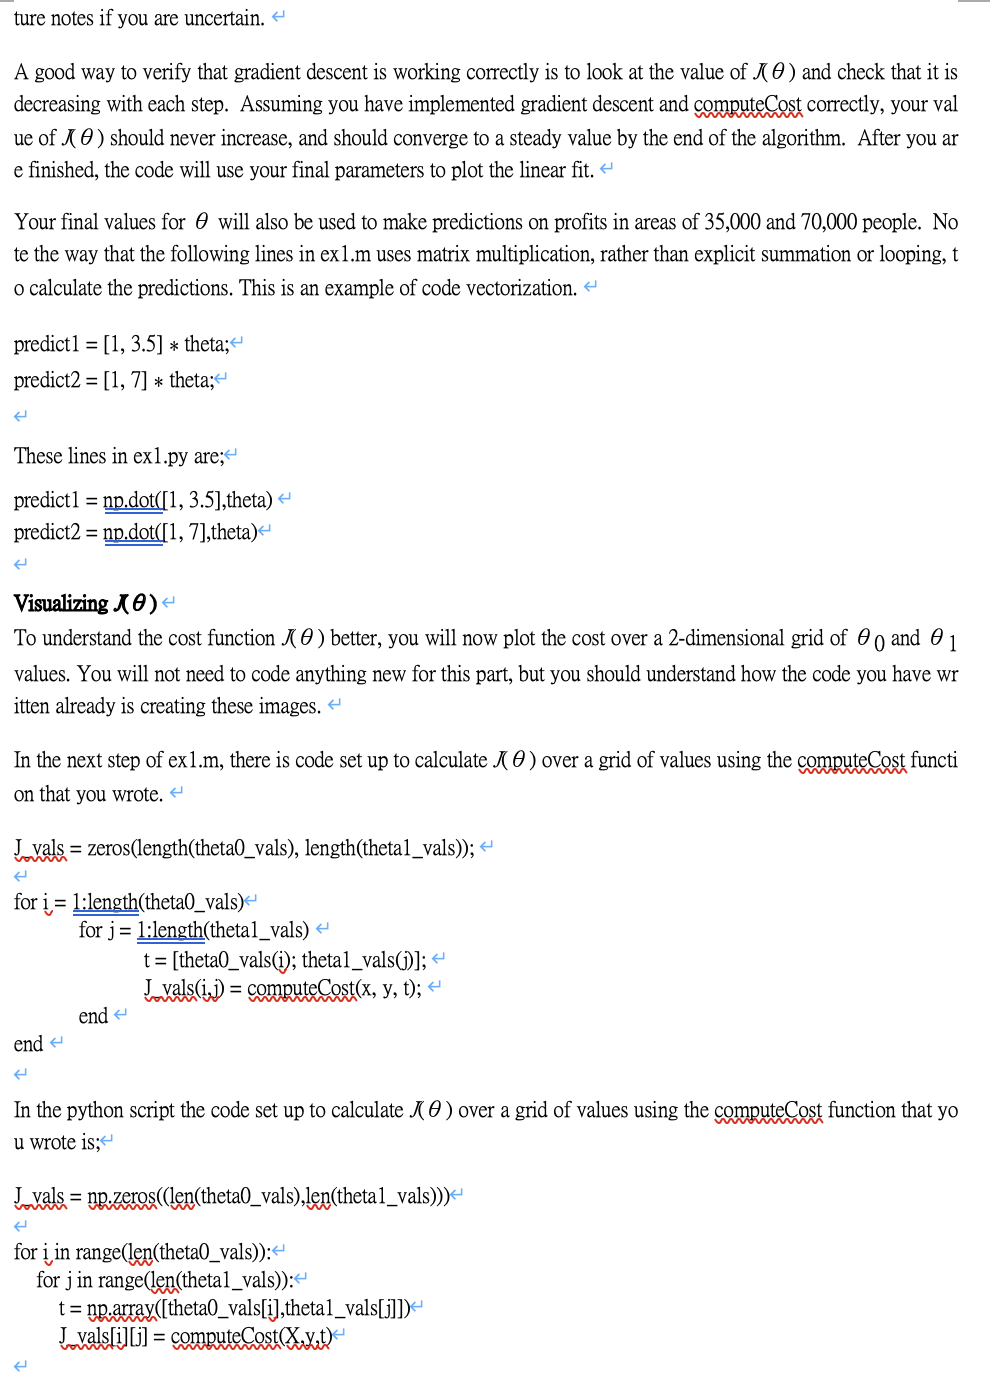
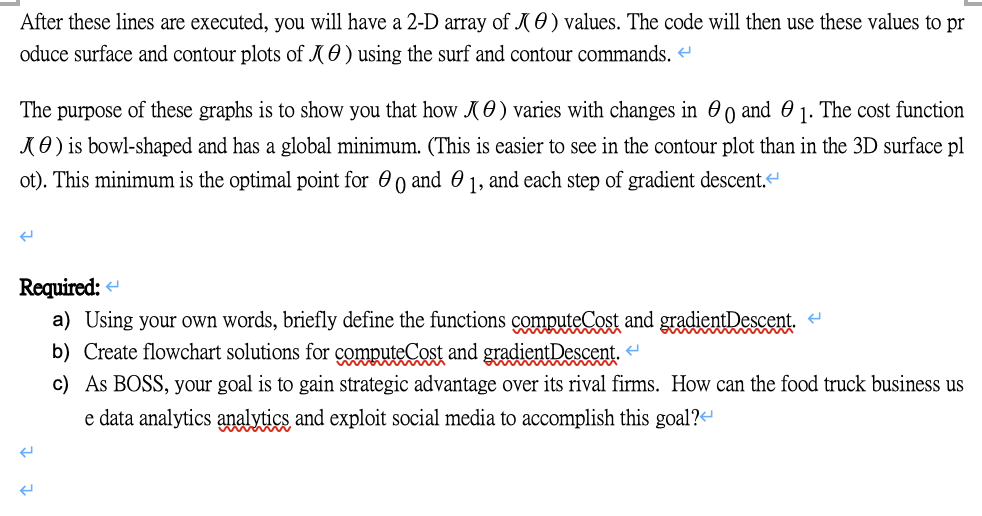
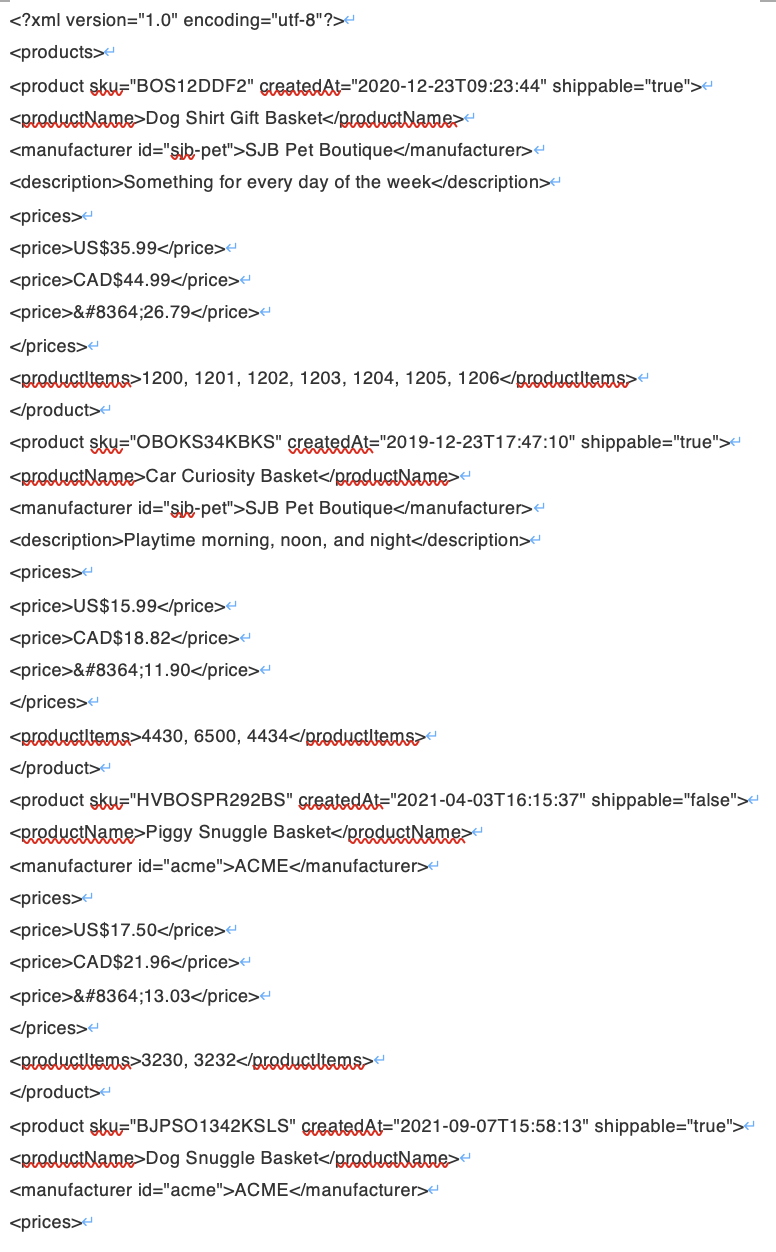
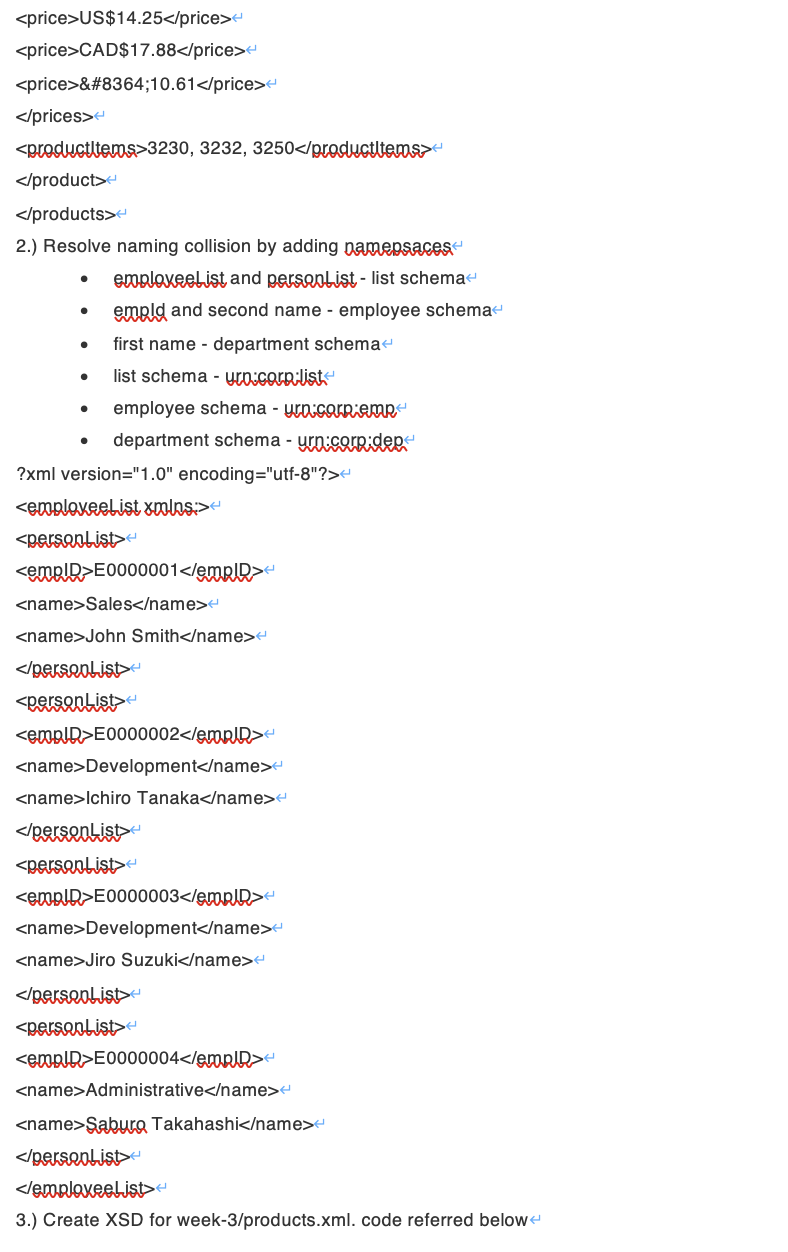
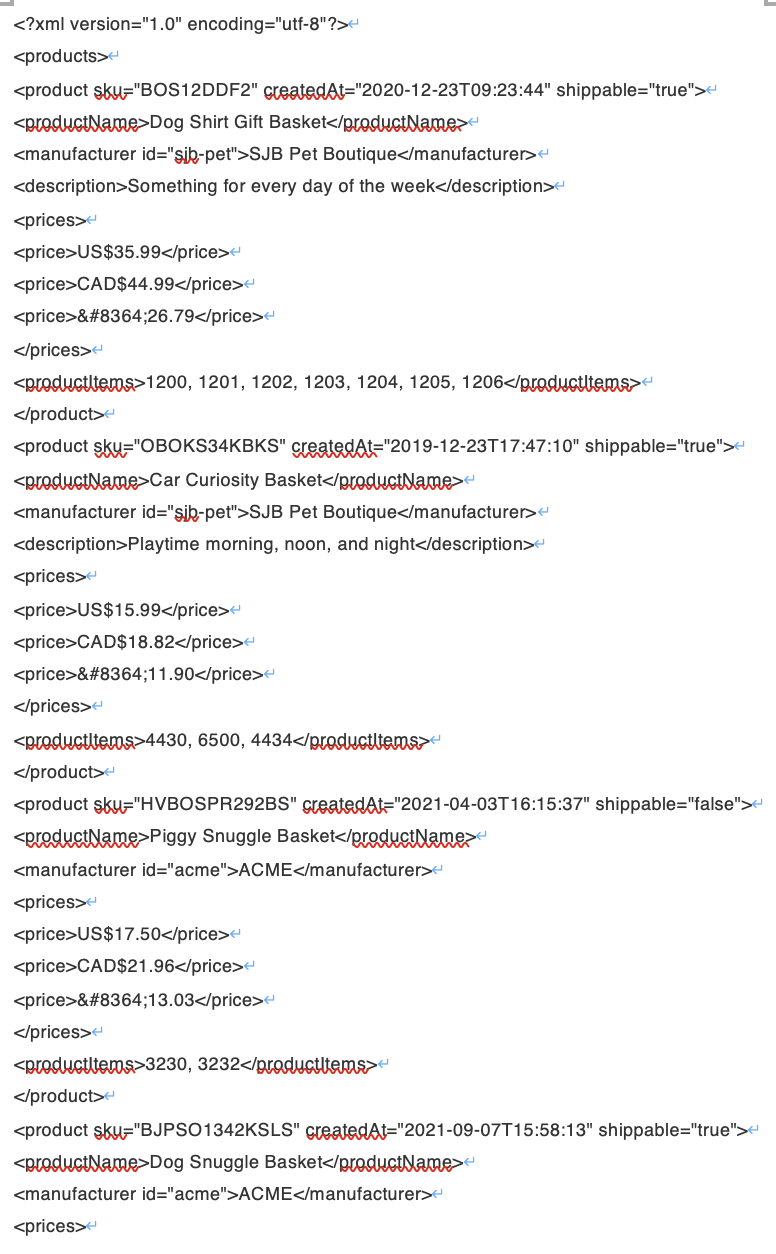
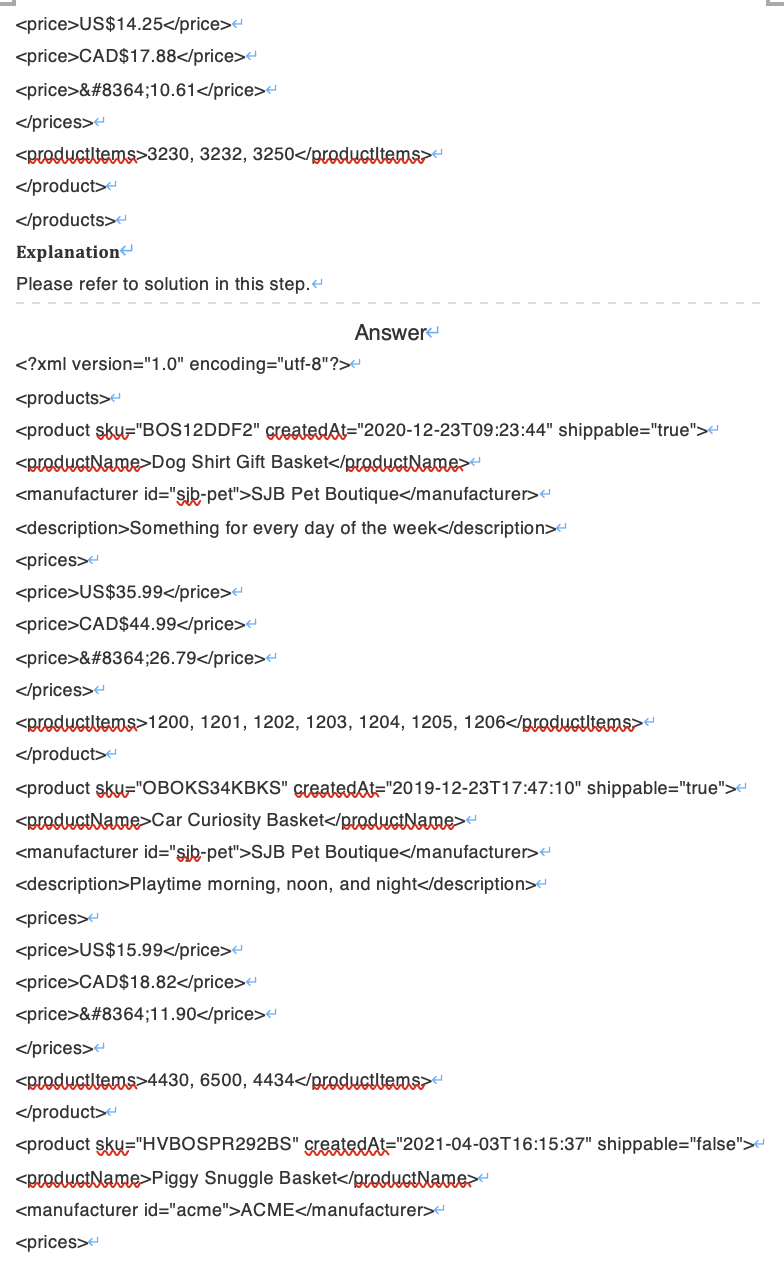
In this task, you will need to implement linear regression and get to see it work on data. For the starter, you will n eed to download the starter code and unzip its contents to the directory where you hope to complete the task. If ne eded, use the cd command in Matlab/Octave or Python to change to this directory before starting this assignment. . . Files included in this assignment exl.py - Python script that will help step you through the assignment exl.m - Matlab/Octave script that will help step you through the assignment exldatal.txt - Dataset for linear regression with one variable [*] plotData.m - Function to display the dataset [*] computeCost.m - Function to compute the cost of linear regression [*] gradientDescent.m - Function to run gradient descent- . . . * indicates files you will need to complete." Throughout the task , you will be using the scripts exl.m or exl.py. These scripts set up the dataset for the proble ms and make calls to functions that you will write. You do not need to modify either of them. You are only requi red to modify functions in other files, by following the instructions in this task. 4 For this programming task, you are required to complete the first part of the task to implement linear regression wi th one variable. The second part of the task, which you must also complete, covers logistic regression. Linear regression with one variable In this part of this assignment, you will implement linear regression with one variable to predict profits for a food t ruck. Suppose you are the BOSS of a restaurant franchise and are considering different cities for opening a new o utlet. The chain already has trucks in various cities and you have data for profits and populations from the cities. You would like to use this data to help you select which city to expand to next. The file exldatal.txt contains the dataset for our linear regression problem. The first column is the population of a city and the second column is the profit of a food truck in that city. A negative value for profit indicates a loss. T he exl.m and ex1.py script have already been set up to load this data for you. Plotting the Data Before starting on any task, it is often useful to understand the data by visualizing it. For this dataset, you can use a scatter plot to visualize the data, since it has only two properties to plot (profit and population). (Many other pro blems that you will encounter in real life are multi-dimensional and can't be plotted on a 2-d plot.) In exl.m, the dataset is loaded from the data file into the variables X and y:- data = load('exldatal.txt'); ture notes if you are uncertain. A good way to verify that gradient descent is working correctly is to look at the value of 10) and check that it is decreasing with each step. Assuming you have implemented gradient descent and computeCost correctly, your val ue of e) should never increase, and should converge to a steady value by the end of the algorithm. After you ar e finished, the code will use your final parameters to plot the linear fit. + Your final values for 0 will also be used to make predictions on profits in areas of 35,000 and 70,000 people. No te the way that the following lines in exl.m uses matrix multiplication, rather than explicit summation or looping, t o calculate the predictions. This is an example of code vectorization. + predict1 = [1, 3.5] * theta; predict2 = [1, 7] * theta; These lines in exl.py are; predictl = np.dot([1, 3.5],theta) predict2 = np.dot([1, 7],theta) Visualizing 10) To understand the cost function (0) better, you will now plot the cost over a 2-dimensional grid of eo and 01 values. You will not need to code anything new for this part, but you should understand how the code you have wr itten already is creating these images. In the next step of exl.m, there is code set up to calculate 10) over a grid of values using the computeCost functi on that you wrote. Lavals = zeros(length(theta_vals), length(thetal_vals)); Dog Shirt Gift BasketSJB Pet BoutiqueSomething for every day of the weekUS$35.99CAD$44.9926.791200, 1201, 1202, 1203, 1204, 1205, 1206 Car Curiosity BasketSJB Pet BoutiquePlaytime morning, noon, and nightUS$15.99CAD$18.8211.904430, 6500, 4434Piggy Snuggle BasketACMEUS$17.50CAD$21.9613.033230, 3232Dog Snuggle BasketACME . . . . . US$14.25CAD$17.8810.613230, 3232, 3250 2.) Resolve naming collision by adding Damepsaces emploxeebist and personbist - list schema emold and second name - employee schema- first name - department schema list schema - uroccordilist employee schema - Ura corriem department schema - urn:corridere ?xml version="1.0" encoding="utf-8"?> E0000001 SalesJohn SmithE0000002DevelopmentIchiro TanakaE0000003 DevelopmentJiro SuzukiE0000004 AdministrativeSabura Takahashi 3.) Create XSD for week-3/products.xml. code referred below Dog Shirt Gift BasketSJB Pet Boutique manufacturer Something for every day of the weekUS$35.99CAD$44.9926.791200, 1201, 1202, 1203, 1204, 1205, 1206 Car Curiosity Basket SJB Pet BoutiquePlaytime morning, noon, and nightUS$15.99CAD$18.8211.904430, 6500, 4434 Piggy Snuggle BasketACMEUS$17.50CAD$21.9613.033230, 3232Dog Snuggle BasketACMEUS$14.25CAD$17.8810.613230, 3232, 3250 Explanation Please refer to solution in this step. Answer Dog Shirt Gift BasketSJB Pet BoutiqueSomething for every day of the weekUS$35.99CAD$44.9926.791200, 1201, 1202, 1203, 1204, 1205, 1206 Car Curiosity BasketSJB Pet BoutiquePlaytime morning, noon, and nightUS$15.99CAD$18.8211.904430, 6500, 4434 Piggy Snuggle BasketACMEUS$17.50CAD$21.9613.033230, 3232Dog Snuggle BasketACMEUS$14.25CAD$17.8810.613230, 3232, 3250 2.) Resolve naming collision by adding namepsaces employeelist and personlist - list schema- empld and second name - employee schema- first name - department schema- list schema - urn:corn:list employee schema - yra:carneme department schema - urocorniden ?xml version="1.0" encoding="utf-8"?>4 E0000001 Sales . John SmithE0000002 DevelopmentIchiro TanakaE0000003 DevelopmentJiro SuzukiE0000004 AdministrativeSabura Takahashi 3.) Create XSD for week-3/products.xml. code referred below Dog Shirt Gift BasketSJB Pet BoutiqueSomething for every day of the weekUS$35.99CAD$44.9926.791200, 1201, 1202, 1203, 1204, 1205, 1206Car Curiosity BasketSJB Pet BoutiquePlaytime morning, noon, and nightUS$15.99CAD$18.8211.904430, 6500, 4434 Piggy Snuggle BasketACMEUS$17.50CAD$21.9613.033230, 3232Dog Snuggle BasketACMEUS$14.25CAD$17.8810.613230, 3232, 3250 Wo - Nam a - ILLU a d i is Editor - /Users/yunccc/Desktop/Third year/BDA/Summative_Assignment_2/Part 2 - Logistic Regression/sigm... computeCost.m X ex1.m X gradientDescent.m sigmoid.m X costFunction.m + 1 function g sigmoid(z) 2 %SIGMOID Compute sigmoid functoon 3 J = SIGMOID(z) computes the sigmoid of z. 4 5 % You need to return the following variables correctly 6 g = zeros(size(z)); 7 8 YOUR CODE HERE 9 % Instructions: Compute the sigmoid of each value of z (z can be a matrix, 10 vector or scalar). 11 12 g = 1.0 / (1.0 + exp(-2)) 13 14 15 16 17 end 18 nm On 000 t t HP HEARDM t t % X Wo Nan Ha Pa Editor - /Users/yunccc/Desktop/Third year/BDA/Summative_Assignment_2/Part 1 - Linear Regression/ex1.m computeCost.m ex1.mx gradientDescent.mx + 58 fprintf('For population = 35,000, we predict a profit of $f ',... 59 predict1*10000); 60 predict2 = (1, 7] * theta; 61 fprintf('For population = 70,000, we predict a profit of $ ',... 62 predict2*10000); 63 64 fprintf('Program paused. Press enter to continue. '); 65 pause; 66 67 ============= Part 3: Visualizing J(theta_0, theta_1) ============= 68 fprintf('Visualizing J(theta_0, theta_1) ... ') 69 70 % Grid over which we will calculate J 71 theta@_vals = linspace(-10, 10, 100); 72 thetal_vals = linspace(-1, 4, 100); HHHHHHHHHHH 74 = 58588%%a88ws % initialize J_vals to a matrix of O's J_vals = zeros(length(theta_vals), length(thetal_vals)); 76 77 78 79 80 81 82 83 84 85 % Fill out j_vals for i = 1: length(theta_vals) for j = 1: length(thetal_vals) t = [thetaQ_vals(i); thetal_vals(j)); J_vals(i, j) = computeCost(x, y, t); end end o Wo Nam a a 4 % % Hit % === SESE Editor - /Users/yunccc/Desktop/Third year/BDA/Summative_Assignment_2/Part 2 - Logistic Regression/cost... computeCost.mx ex1.mx gradientDescent.mx sigmoid.mx costFunction.m* x + 2 20 COSTFUNCTION Compute cost and gradient for logistic regression 3 J = COSTFUNCTION(theta, x, y) computes the cost of using theta as the parameter for logistic regression and the gradient of the cost 5 w.r.t. to the parameters. 6 7 % Initialize some useful values 8 m = length(y); $ number of training examples 9 10 % You need to return the following variables correctly 11 J = 0; 12 grad = zeros(size(theta)); 13 14 ============ YOUR CODE HERE ==== 15 % Instructions: Compute the cost of a particular choice of theta. 16 You should set j to the cost. 17 % Compute the partial derivatives and set grad to the partial 18 % derivatives of the cost w.r.t. each parameter in theta 19 20 % Note: grad should have the same dimensions as theta 21 22 23 z = X * theta; 24 25 h=sigmoid(z); 26 27 J = (1/m)* sum(-y.* log(h) - (1-y).* log(1-h)); 28 29 grad = (1/m).* X * (h-y); 30 31 32 33 34 end 35 HV % Wo Nam O a a % FHI Editor - /Users/yunccc/Desktop/Third year/BDA/Summative_Assignment_2/Part 2 - Logistic Regression/pred... computeCost.mx ex1.mx gradientDescent.mx sigmoid.mx costFunction.m predict.m* x + 12 function p = predict(theta, X) 2 2 %PREDICT Predict whether the label is 9 or 1 using learned logistic 3 %regression parameters theta 4 p = PREDICT (theta, X) computes the predictions for X using a 5 threshold at 0.5 (i.e., if sigmoid(theta'+x) >= 0.5, predict 1) 6 7 m = size (X, 1); % Number of training examples 8 9 % You need to return the following variables correctly 10 p = zeros(m, 1); 11 12 E ============ ========= YOUR CODE HERE ========== 13 % Instructions: Complete the following code to make predictions using 14 your learned logistic regression parameters. 15 85 You should set p to a vector of O's and 1's 16 % 17 18 z = X * theta; 19 20 h=sigmoid(z); 21 22 for i = 1:m; 23 if (sigmoid(z(i)> .5) 24 p(i)=1; 25 else 26 p(i)=0; 27 end 28 end 29 | 30 31 32 33 34 end BBBBBBBBBBBBB I TI o x Wo Nan + a ti $ THE Editor - /Users/yunccc/Desktop/Third year/BDA/Summative_Assignment_2/Part 2 - Logistic Regression/ex2.m +1 ex1.m x gradientDescent.mx sigmoid.m costFunction.m x predict.m ex2.m X 1 %Logistic Regression 2 3 Instructions 4 5 6 This file contains code that helps you get started on the logistic 7 % regression exercise. You will need to complete the following functions 8 % in this exericse: 9 10 sigmoid.m 11 % costFunction.m 12 predict.m 13 14 $ For this exercise, you will not need to change any code in this file, 15 or any other files other than those mentioned above. 16 17 18 $% Initialization 19 clear all, close all; clc 20 21 * Load Data 22 % The first two columns contains the exam scores and the third column 23 % contains the label. 24 25 data = load('ex2datai.txt'); 26 X = data(:, [1, 2]); y = data(:, 3); 27 28 % ==================== Part 1: Plotting ==================== 29 % We start the exercise by first plotting the data to understand the 30 the problem we are working with. 31 32 fprintf(['Plotting data with + indicating (y = 1) examples and O' ... 33 'indicating (y = 0) examples. ']); 34 % HV Wo - Nam a Hi a d i NM ON 00 is t t Editor - /Users/yunccc/Desktop/Third year/BDA/Summative_Assignment_2/Part 1 - Linear Regression/ex1.m computeCost.m ex1.m x gradientDescent.m X + 1 %Linear Regression 2 3 Instructions 4 5 6 This file contains code that helps you get started on the 7 linear regression lab. 8 9 % X refers to the population size in 10,000s 10 % y refers to the profit in $10,000s 11 12 13 0% Initialization 14 clear all; close all; clc 15 16 17 Part 1: Plotting fprintf('Plotting Data ... ') 19 data = load('exidatal.txt'); 20 X = data(:, 1); y data(:, 2); 21 length(y); % number of training examples 22 23 % Plot Data 24 % Note: You have to complete the code in plotData.m 25 plotData(x, y); 26 fprintf('Program paused. Press enter to continue. '); 28 pause; Ht ULU OUD t 18 m = 27 X Wo Nan Ha Pa Editor - /Users/yunccc/Desktop/Third year/BDA/Summative_Assignment_2/Part 1 - Linear regression/ex1.m computeCost.m ex1.mx gradientDescent.m + 73 74 % initialize J_vals to a matrix of O's 75 J_vals = zeros(length(theta_vals), length(theta1_vals)); 76 77 % Fill out j_vals 78 for i = 1: length(theta)_vals) 79 for j = 1: length(thetal_vals) 80 t = [theta_vals(i); theta1_vals(j)); 81 J_vals(i,j) = computeCost(x, y, t); 82 end 83 end 84 85 86 87 J_vals = J_vals'; 88 % Surface plot 89 figure; 90 surf(theta_vals, theta1_vals, J_vals) 91
Step by Step Solution
There are 3 Steps involved in it
1 Expert Approved Answer
Step: 1 Unlock
Question Has Been Solved by an Expert!
Get step-by-step solutions from verified subject matter experts
Step: 2 Unlock
Step: 3 Unlock
Students Have Also Explored These Related Databases Questions!


![linear regression with one variable [*] plotData.m - Function to display the](https://dsd5zvtm8ll6.cloudfront.net/si.experts.images/questions/2024/09/66f1673e7755c_63766f1673de8478.jpg)
![dataset [*] computeCost.m - Function to compute the cost of linear regression](https://dsd5zvtm8ll6.cloudfront.net/si.experts.images/questions/2024/09/66f1673f37759_63866f1673ea949c.jpg)
![[*] gradientDescent.m - Function to run gradient descent- . . . *](https://dsd5zvtm8ll6.cloudfront.net/si.experts.images/questions/2024/09/66f16740033e5_63966f1673f6be30.jpg)