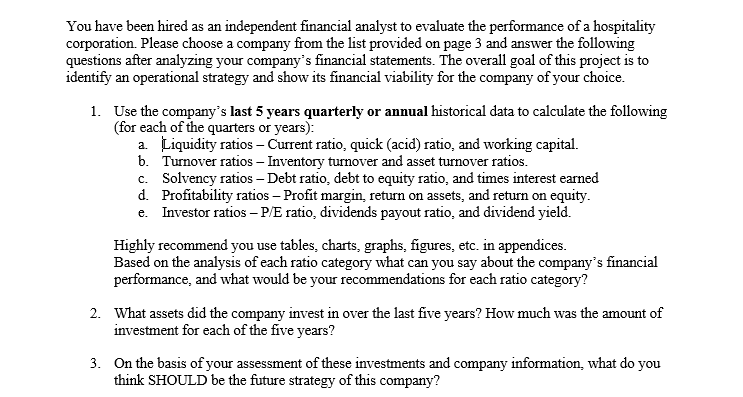
Below is the Data.
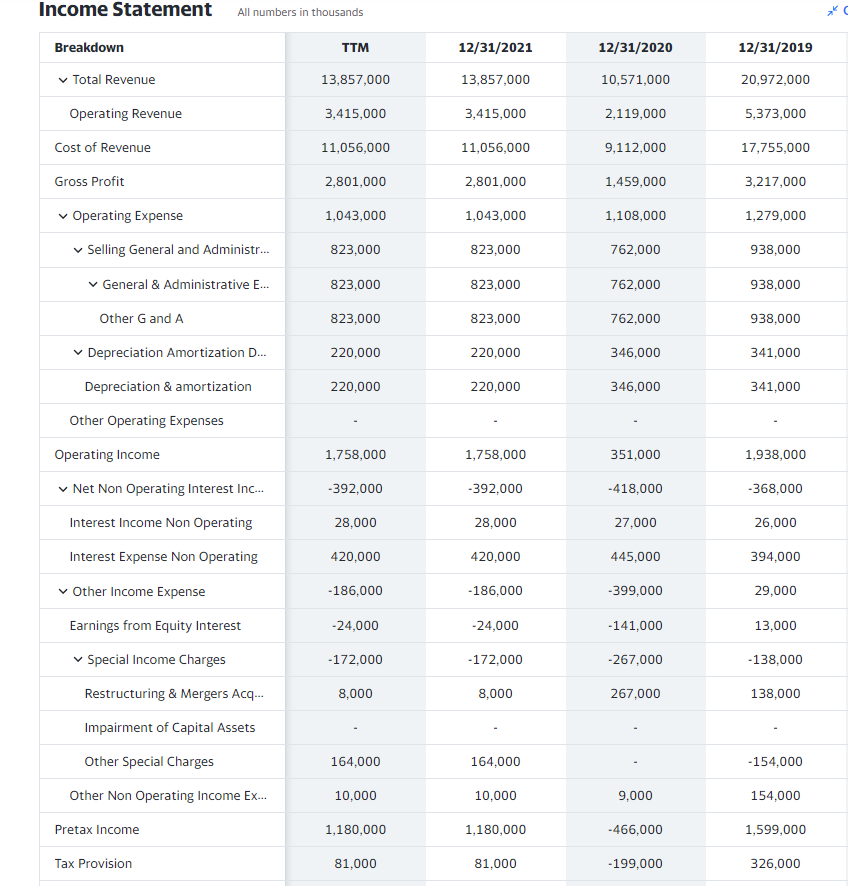
TTM 12/31/2021 12/31/2020
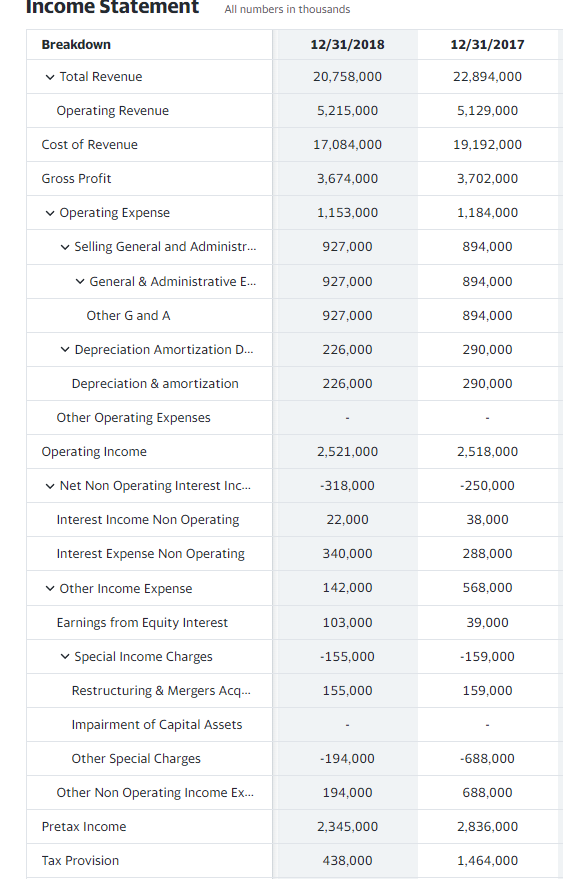
12/31/2019 12/31/2018 12/31/2017
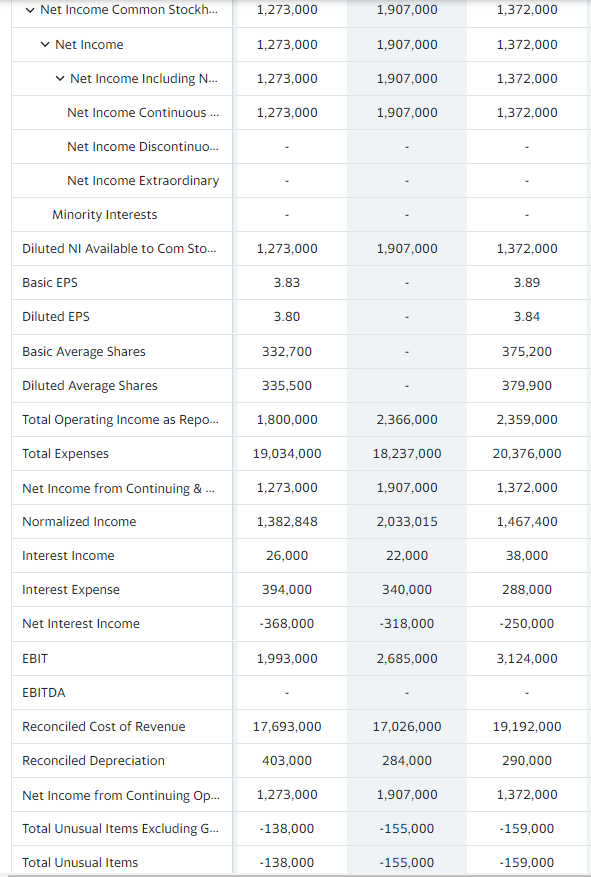
TTM 12/31/2021 12/31/2020

12/31/2019 12/31/2018 12/31/2017

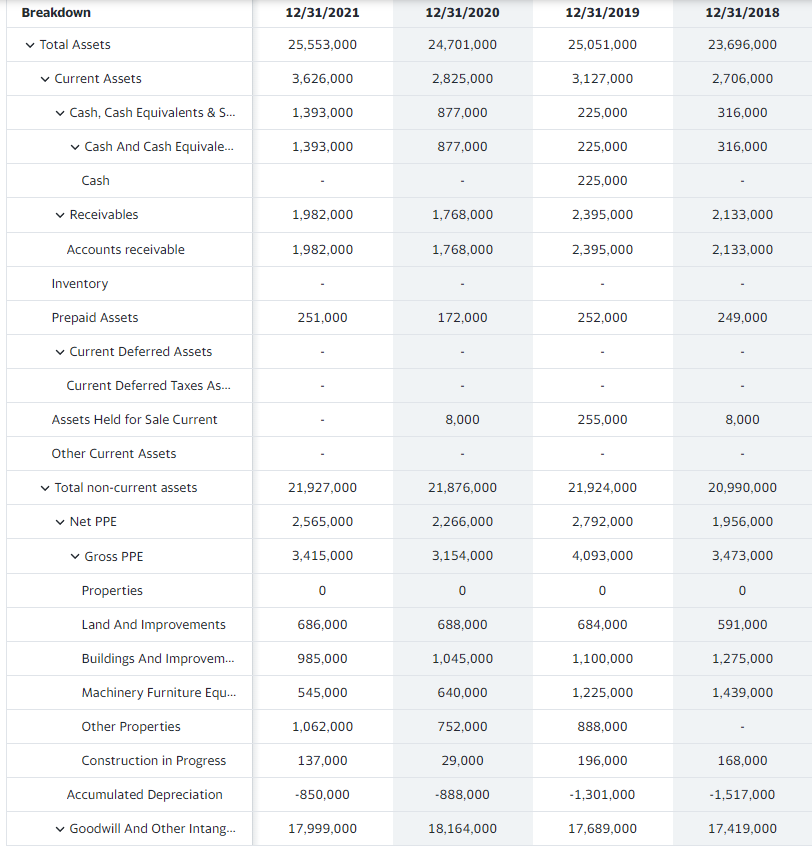
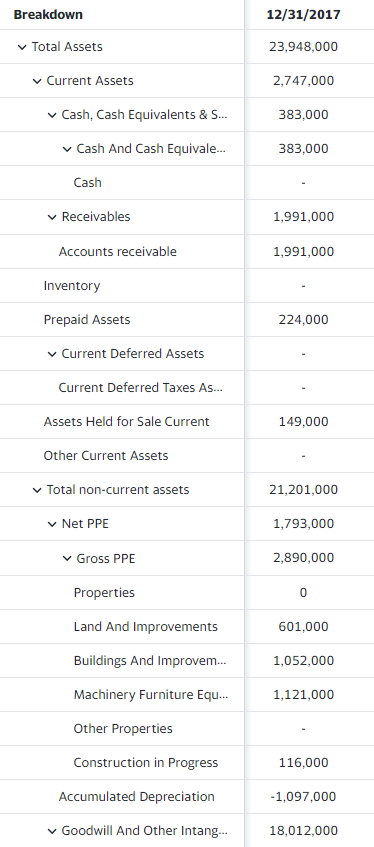
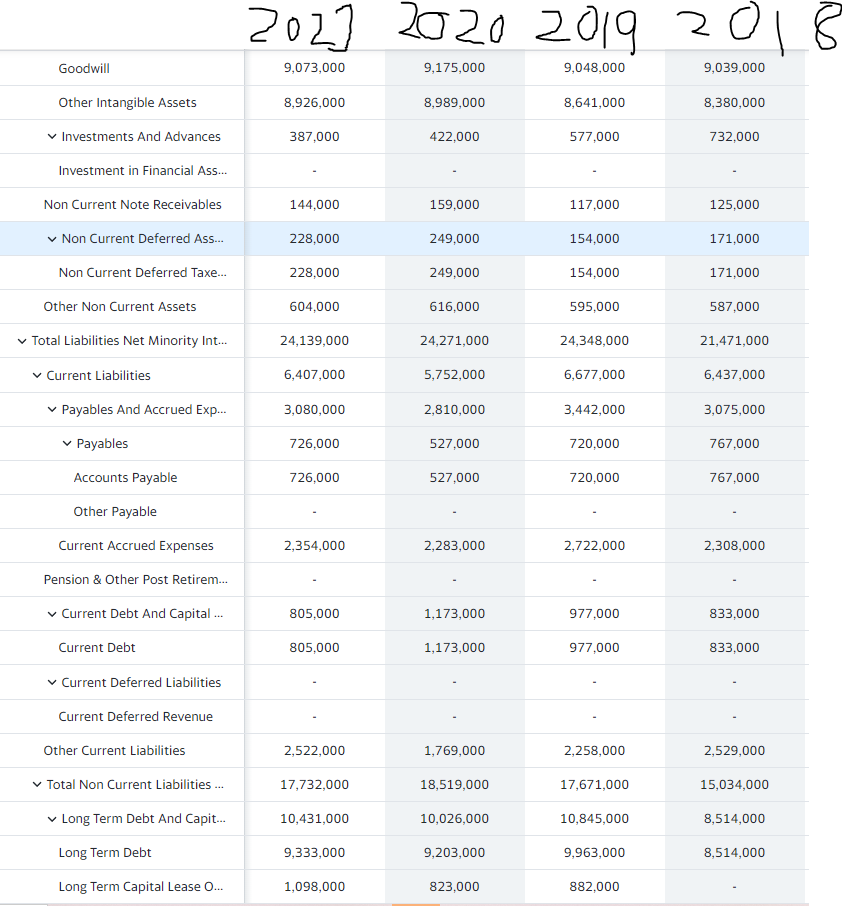
Balance Sheet
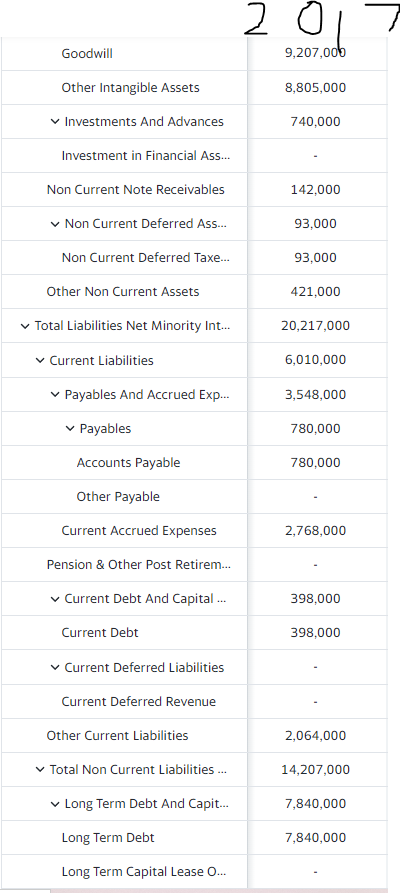
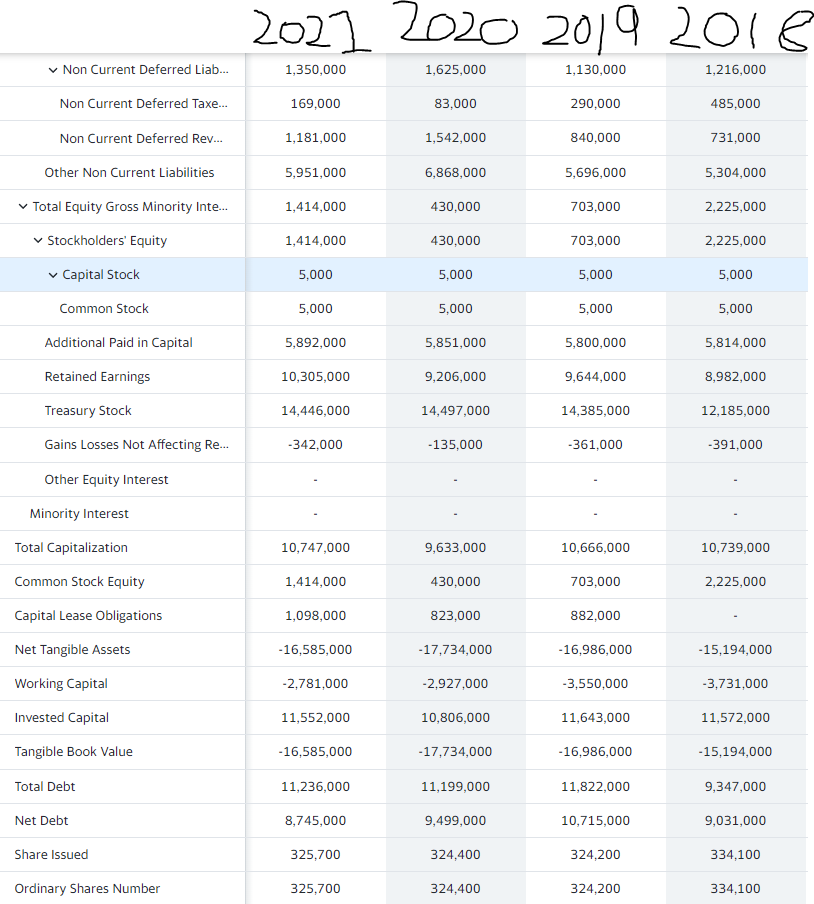
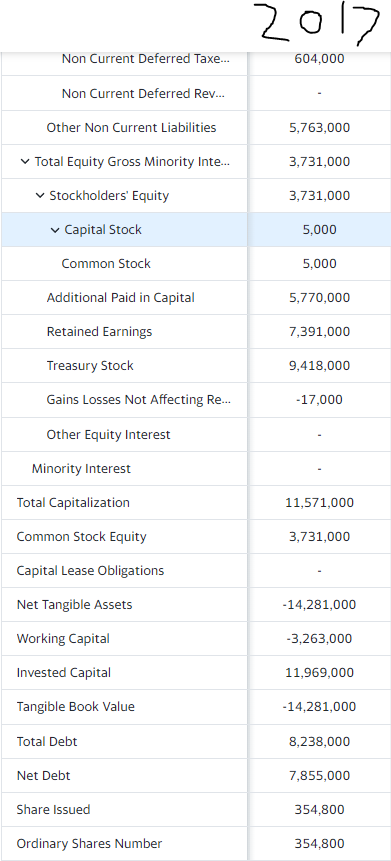
Cash Flow
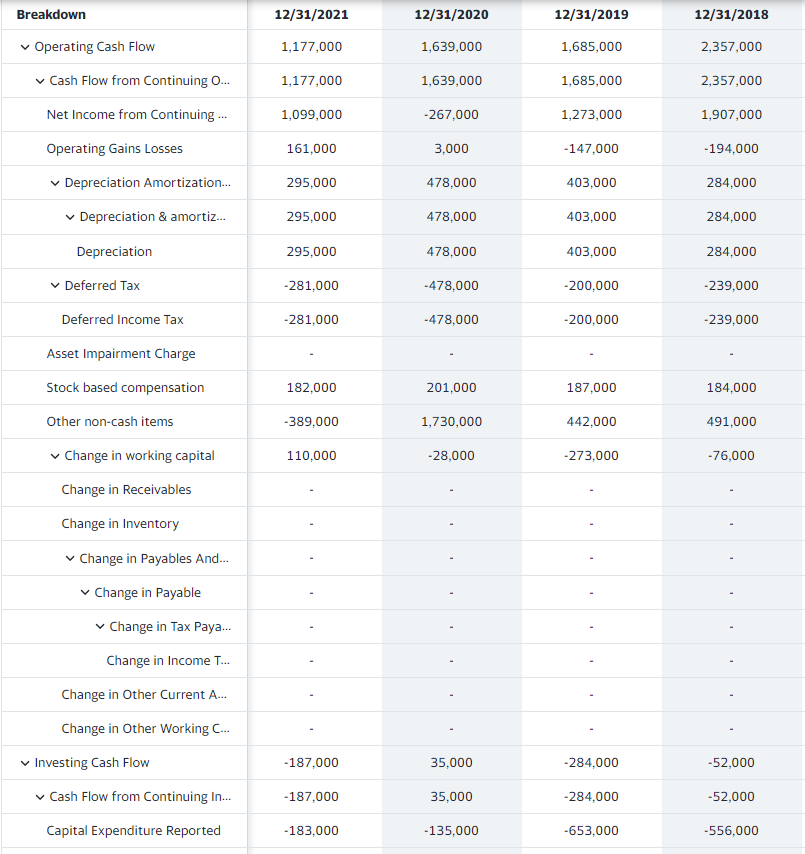
2021 2020 2019 2018
2021 2020 2019 2018
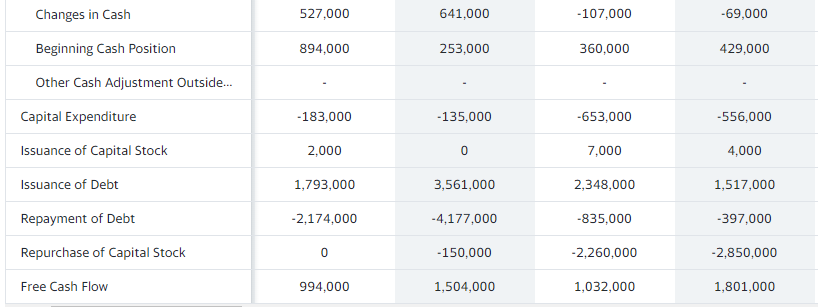
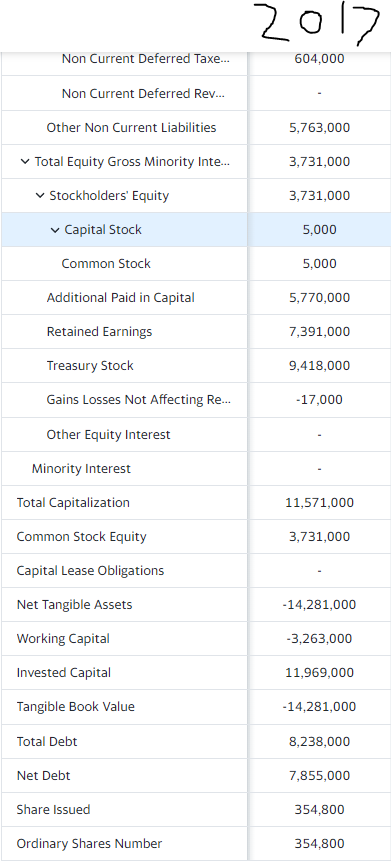
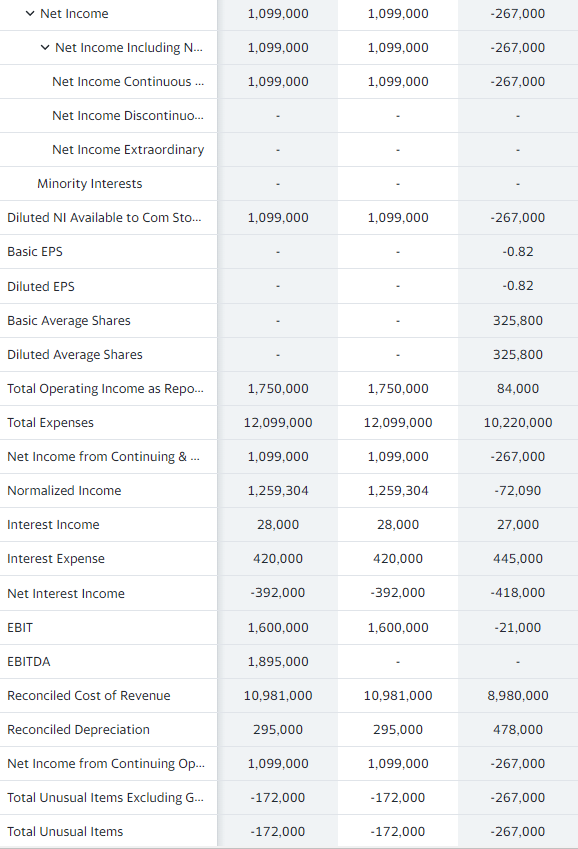
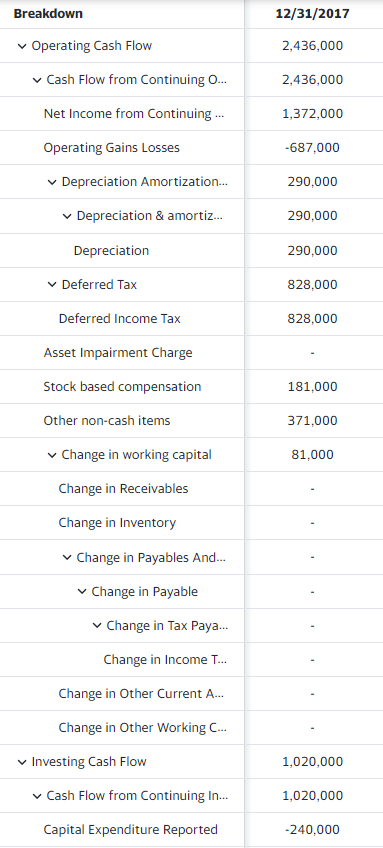
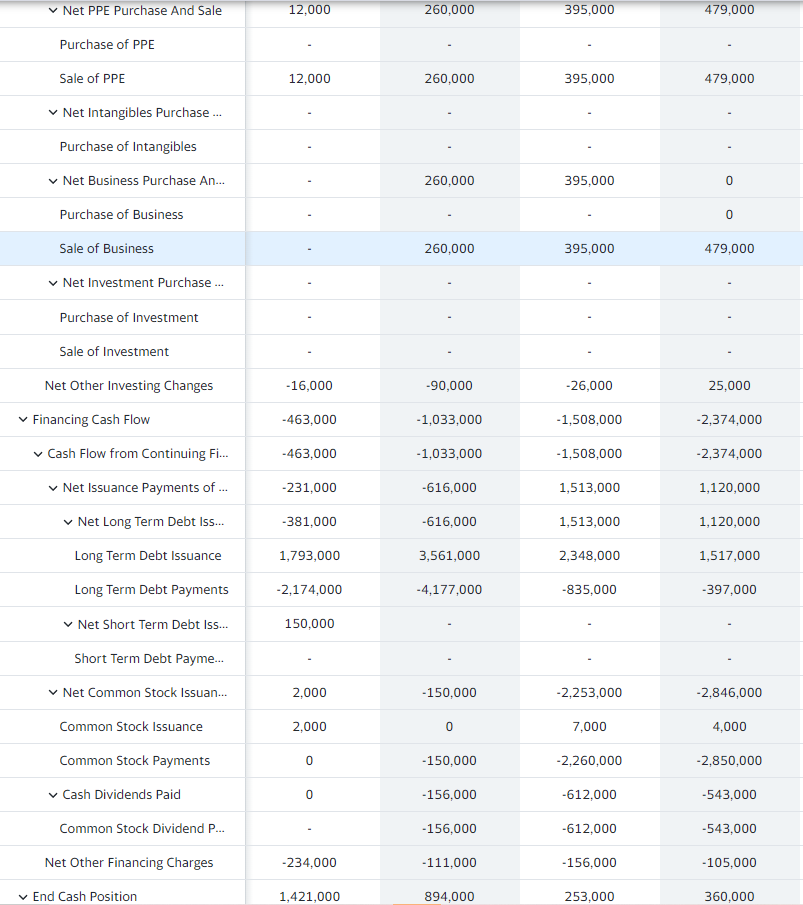
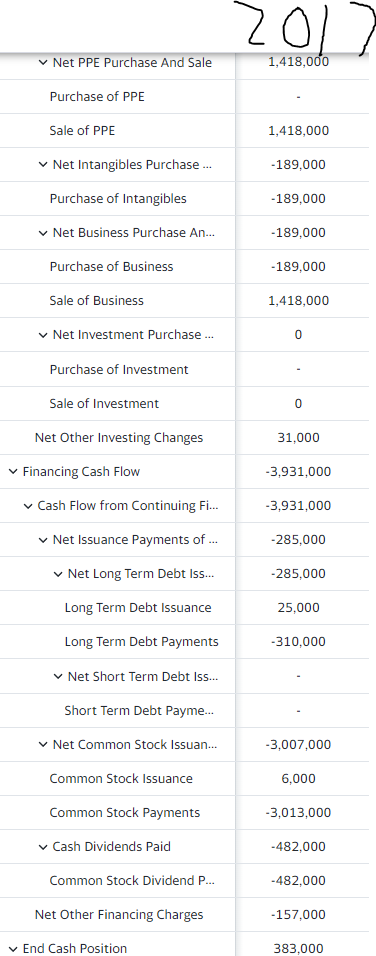
You have been hired as an independent financial analyst to evaluate the performance of a hospitality corporation. Please choose a company from the list provided on page 3 and answer the following questions after analyzing your company's financial statements. The overall goal of this project is to identify an operational strategy and show its financial viability for the company of your choice. 1. Use the company's last 5 years quarterly or annual historical data to calculate the following (for each of the quarters or years): a. Liquidity ratios - Current ratio, quick (acid) ratio, and working capital. b. Turnover ratios Inventory turnover and asset turnover ratios. c. Solvency ratios Debt ratio, debt to equity ratio, and times interest earned d. Profitability ratios Profit margin. return on assets, and return on equity. e. Investor ratios P/E ratio, dividends payout ratio, and dividend yield. Highly recommend you use tables, charts, graphs, figures, etc. in appendices. Based on the analysis of each ratio category what can you say about the company's financial performance, and what would be your recommendations for each ratio category? 2. What assets did the company invest in over the last five years? How much was the amount of investment for each of the five years? 3. On the basis of your assessment of these investments and company information, what do you think SHOULD be the future strategy of this company? Income Statement All numbers in thousands TTM 12/31/2021 12/31/2020 12/31/2019 Breakdown Total Revenue 13,857,000 13,857,000 10,571,000 20,972,000 Operating Revenue 3,415,000 3,415,000 2,119,000 5,373,000 Cost of Revenue 11,056,000 11,056,000 9,112,000 17,755,000 Gross Profit 2,801,000 2,801,000 1,459,000 3,217,000 1,043,000 1,043,000 1,108,000 1,279,000 Operating Expense Selling General and Administr... 823,000 823,000 762,000 938,000 General & Administrative E... 823,000 823,000 762,000 938,000 Other G and A 823,000 823,000 762,000 938,000 Depreciation Amortization D... 220,000 220,000 346,000 341,000 Depreciation & amortization 220,000 220,000 346,000 341,000 Other Operating Expenses Operating Income 1,758,000 1,758,000 351,000 1,938,000 Net Non Operating Interest Inc... -392,000 -392,000 -418.000 -368,000 Interest Income Non Operating 28,000 28,000 27,000 26,000 Interest Expense Non Operating 420,000 420,000 445,000 394,000 Other Income Expense -186,000 -186,000 -399,000 29,000 Earnings from Equity Interest -24,000 -24,000 -141,000 13,000 Special Income Charges -172,000 -172,000 -267,000 -138,000 8,000 8,000 267,000 138,000 Restructuring & Mergers Acq... Impairment of Capital Assets Other Special Charges 164,000 164,000 -154,000 Other Non Operating Income Ex... 10,000 10,000 9,000 154,000 Pretax Income 1,180,000 1,180,000 -466,000 1,599,000 Tax Provision 81,000 81,000 - 199,000 326,000 Income Statement All numbers in thousands 12/31/2018 12/31/2017 Breakdown Total Revenue 20,758,000 22,894,000 Operating Revenue 5,215,000 5,129,000 Cost of Revenue 17,084,000 19,192,000 Gross Profit 3,674,000 3,702,000 Operating Expense 1,153,000 1,184,000 Selling General and Administr... 927,000 894,000 927,000 894,000 General & Administrative E... Other G and A 927,000 894,000 Depreciation Amortization D... 226,000 290,000 Depreciation & amortization 226,000 290,000 Other Operating Expenses Operating Income 2,521,000 2,518,000 Net Non Operating Interest Inc... -318,000 -250,000 Interest Income Non Operating 22,000 38,000 Interest Expense Non Operating 340,000 288,000 Other Income Expense 142,000 568,000 Earnings from Equity Interest 103,000 39,000 Special Income Charges -155,000 -159,000 Restructuring & Mergers Acq... 155,000 159.000 Impairment of Capital Assets Other Special Charges -194,000 -688,000 Other Non Operating Income Ex... 194,000 688,000 Pretax Income 2,345,000 2,836,000 Tax Provision 438,000 1,464,000 Net Income 1,099,000 1,099,000 -267,000 1,099,000 1,099,000 -267,000 Net Income Including N... Net Income Continuous ... 1.099,000 1,099,000 -267,000 Net Income Discontinuo... Net Income Extraordinary Minority Interests Diluted NI Available to Com Sto... 1,099,000 1,099,000 -267,000 Basic EPS -0.82 Diluted EPS -0.82 325,800 Basic Average Shares Diluted Average Shares 325,800 Total Operating Income as Repo... 1,750,000 1,750,000 84,000 Total Expenses 12,099,000 12,099,000 10,220,000 Net Income from Continuing & .. 1,099,000 1,099,000 -267,000 Normalized Income 1,259,304 1,259,304 -72,090 Interest Income 28,000 28,000 27,000 Interest Expense 420,000 420,000 445,000 Net Interest Income -392,000 -392,000 -418,000 EBIT 1,600,000 1,600,000 -21,000 EBITDA 1,895,000 Reconciled Cost of Revenue 10,981,000 10,981,000 8,980,000 295,000 295,000 478,000 Reconciled Depreciation Net Income from Continuing Op... 1,099,000 1,099,000 -267,000 Total Unusual Items Excluding G... -172,000 -172,000 -267,000 Total Unusual Items -172,000 -172,000 -267,000 Net Income Common Stockh... 1,273,000 1,907,000 1,372.000 Net Income 1,273,000 1,907,000 1,372,000 Net Income Including N... 1,273,000 1,907,000 1,372,000 Net Income Continuous ... 1,273,000 1,907,000 1,372,000 Net Income Discontinuo... Net Income Extraordinary Minority Interests Diluted NI Available to Com Sto... 1,273,000 1,907,000 1,372,000 Basic EPS 3.83 3.89 Diluted EPS 3.80 3.84 Basic Average Shares 332,700 375,200 Diluted Average Shares 335,500 379,900 Total Operating Income as Repo... 1,800,000 2,366,000 2,359,000 Total Expenses 19,034.000 18,237,000 20,376,000 1,273,000 1,907,000 1,372,000 Net Income from Continuing &... Normalized Income 1,382,848 2,033,015 1,467,400 Interest Income 26,000 22,000 38,000 Interest Expense 394,000 340,000 288,000 Net Interest Income -368,000 -318,000 -250,000 EBIT 1,993,000 2,685,000 3,124,000 EBITDA Reconciled Cost of Revenue 17,693,000 17,026,000 19,192,000 Reconciled Depreciation 403,000 284,000 290,000 Net Income from Continuing Op... 1,273,000 1,907,000 1,372,000 Total Unusual Items Excluding G... -138,000 -155,000 -159,000 Total Unusual Items -138,000 -155,000 -159,000 Normalized EBITDA 2,067,000 2,067,000 724,000 Tax Rate for Calcs 0 0 0 Tax Effect of Unusual Items -11,696 -11,696 -72,090 Normalized EBITDA 2.534,000 3,124,000 3,573,000 Tax Rate for Calcs 0 0 0 Tax Effect of Unusual Items -28,152 -28,985 -63,600 12/31/2021 12/31/2020 12/31/2019 12/31/2018 Breakdown Total Assets 25,553,000 24,701,000 25,051,000 23,696,000 Current Assets 3,626,000 2,825,000 3,127,000 2,706,000 Cash, Cash Equivalents & S... 1,393,000 877,000 225,000 316,000 Cash And Cash Equivale... 1,393,000 877,000 225,000 316,000 Cash 225,000 Receivables 1,982,000 1,768,000 2,395,000 2,133,000 Accounts receivable 1,982,000 1,768,000 2,395,000 2,133,000 Inventory 251,000 172.000 252,000 249,000 Prepaid Assets Current Deferred Assets Current Deferred Taxes A... Assets Held for Sale Current 8,000 255,000 8,000 Other Current Assets Total non-current assets 21,927,000 21,876,000 21,924,000 20,990,000 Net PPE 2,565,000 2,266,000 2,792,000 1,956,000 Gross PPE 3,415,000 3,154,000 4,093,000 3,473,000 Properties 0 0 0 0 Land And Improvements 686,000 688,000 684,000 591,000 Buildings And Improvem... 985,000 1,045,000 1,100,000 1,275,000 Machinery Furniture Equ... 545,000 640,000 1,225,000 1,439,000 Other Properties 1,062,000 752,000 888,000 Construction in Progress 137,000 29,000 196,000 168,000 Accumulated Depreciation -850,000 -888,000 -1,301,000 -1,517,000 Goodwill And Other Intang... 17,999,000 18,164,000 17,689,000 17,419,000 Breakdown 12/31/2017 Total Assets 23,948,000 Current Assets 2,747,000 Cash, Cash Equivalents & S... 383,000 Cash And Cash Equivale... 383,000 Cash Receivables 1,991,000 Accounts receivable 1,991,000 Inventory Prepaid Assets 224,000 Current Deferred Assets Current Deferred Taxes As... Assets Held for Sale Current 149,000 Other Current Assets Total non-current assets 21,201,000 Net PPE 1,793,000 Gross PPE 2,890,000 Properties 0 Land And Improvements 601,000 Buildings And Improvem... 1,052,000 Machinery Furniture Equ... 1,121,000 Other Properties Construction in Progress 116,000 Accumulated Depreciation -1,097,000 Goodwill And Other Intang... 18,012,000 2027 2020 2019 2018 8 Goodwill 9,073,000 9,175,000 9,048,000 9,039,000 Other Intangible Assets 8,926,000 8,989,000 8,641,000 8,380,000 Investments And Advances 387,000 422,000 577,000 732,000 Investment in Financial Ass... Non Current Note Receivables 144,000 159.000 117,000 125,000 Non Current Deferred As... 228,000 249,000 154.000 171,000 Non Current Deferred Taxe... 228,000 249,000 154,000 171.000 Other Non Current Assets 604.000 616,000 595,000 587,000 Total Liabilities Net Minority Int... 24,139,000 24,271,000 24,348,000 21,471,000 Current Liabilities 6,407,000 5,752,000 6,677,000 6,437,000 Payables And Accrued Exp... 3,080,000 2,810,000 3,442,000 3,075,000 Payables 726,000 527,000 720,000 767,000 Accounts Payable 726,000 527,000 720,000 767,000 Other Payable Current Accrued Expenses 2,354,000 2,283,000 2,722,000 2,308,000 Pension & Other Post Retirem... Current Debt And Capital ... 805,000 1,173,000 977,000 833,000 Current Debt 805,000 1,173,000 977,000 833,000 Current Deferred Liabilities Current Deferred Revenue Other Current Liabilities 2,522,000 1,769,000 2,258,000 2,529,000 Total Non Current Liabilities ... 17,732,000 18,519,000 17,671,000 15,034,000 Long Term Debt And Capit... 10,431,000 10,026,000 10,845,000 8,514,000 Long Term Debt 9,333,000 9,203,000 9,963,000 8,514,000 Long Term Capital Lease O... 1,098,000 823,000 882,000 201 Goodwill 9,207,000 8,805,000 Other Intangible Assets Investments And Advances 740,000 Investment in Financial Ass... Non Current Note Receivables 142.000 Non Current Deferred As... 93,000 Non Current Deferred Taxe... 93,000 Other Non Current Assets 421,000 Total Liabilities Net Minority Int... 20,217,000 Current Liabilities 6,010,000 Payables And Accrued Exp... 3,548,000 Payables 780,000 Accounts Payable 780,000 Other Payable Current Accrued Expenses 2,768,000 Pension & Other Post Retirem... Current Debt And Capital ... 398,000 Current Debt 398,000 Current Deferred Liabilities Current Deferred Revenue Other Current Liabilities 2,064,000 Total Non Current Liabilities... 14,207,000 Long Term Debt And Capit... 7,840,000 Long Term Debt 7,840,000 Long Term Capital Lease O... 2021 2020 2019 2018 Non Current Deferred Liab... 1,350,000 1,625,000 1,130,000 1,216,000 Non Current Deferred Taxe... 169,000 83,000 290,000 485,000 Non Current Deferred Rev... 1,181,000 1,542,000 840,000 731,000 Other Non Current Liabilities 5,951,000 6,868,000 5,696,000 5,304,000 Total Equity Gross Minority Inte... 1,414,000 430,000 703,000 2,225,000 Stockholders' Equity 1,414,000 430,000 703,000 2,225,000 Capital Stock 5,000 5,000 5,000 5,000 Common Stock 5,000 5,000 5,000 5,000 Additional Paid in Capital 5,892,000 5,851,000 5,800,000 5,814,000 Retained Earnings 10,305,000 9,206,000 9,644,000 8,982,000 Treasury Stock 14,446,000 14,497,000 14,385,000 12,185,000 Gains Losses Not Affecting Re... -342,000 -135,000 -361,000 -391,000 Other Equity Interest Minority Interest Total Capitalization 10,747,000 9,633,000 10,666,000 10,739,000 Common Stock Equity 1,414,000 430,000 703,000 2,225,000 Capital Lease Obligations 1,098,000 823,000 882,000 Net Tangible Assets -16,585,000 -17,734,000 -16,986,000 -15,194,000 Working Capital -2.781,000 -2,927,000 -3,550,000 -3,731,000 Invested Capital 11,552,000 10,806,000 11,643,000 11,572,000 Tangible Book Value -16,585,000 -17,734,000 -16,986,000 -15,194,000 Total Debt 11,236,000 11,199,000 11,822,000 9,347,000 Net Debt 8,745,000 9,499,000 10,715,000 9,031,000 Share Issued 325,700 324,400 324,200 334,100 Ordinary Shares Number 325,700 324,400 324,200 334,100 2017 Non Current Deferred Taxe... 604,000 Non Current Deferred Rev... Other Non Current Liabilities 5,763,000 Total Equity Gross Minority Inte... 3,731,000 Stockholders' Equity 3,731,000 Capital Stock 5,000 Common Stock 5,000 Additional Paid in Capital 5,770,000 Retained Earnings 7,391,000 Treasury Stock 9,418,000 Gains Losses Not Affecting Re... -17,000 Other Equity Interest Minority Interest Total Capitalization 11,571,000 Common Stock Equity 3,731,000 Capital Lease Obligations Net Tangible Assets -14,281,000 Working Capital -3,263,000 Invested Capital 11,969,000 Tangible Book Value -14,281,000 Total Debt 8,238,000 Net Debt 7,855,000 Share Issued 354,800 Ordinary Shares Number 354,800 Breakdown 12/31/2021 12/31/2020 12/31/2019 12/31/2018 Operating Cash Flow 1,177,000 1,639,000 1,685,000 2,357,000 Cash Flow from Continuing O... 1,177,000 1,639,000 1,685,000 2,357,000 Net Income from Continuing ... 1,099,000 -267,000 1,273,000 1,907,000 Operating Gains Losses 161,000 3,000 -147,000 -194,000 Depreciation Amortization... 295,000 478,000 403,000 284,000 Depreciation & amortiz... 295,000 478,000 403,000 284,000 Depreciation 295,000 478,000 403,000 284,000 Deferred Tax -281,000 -478,000 -200,000 -239,000 Deferred Income Tax -281,000 -478,000 -200,000 -239,000 Asset Impairment Charge Stock based compensation 182,000 201,000 187,000 184,000 Other non-cash items -389,000 1,730,000 442,000 491,000 110,000 -28,000 -273,000 -76,000 Change in working capital Change in Receivables Change in Inventory Change in Payables And... Change in Payable Change in Tax Paya... Change in Income T... Change in Other Current A... Change in Other Working C... Investing Cash Flow -187,000 35,000 -284,000 -52,000 Cash Flow from Continuing In... -187,000 35.000 -284,000 -52,000 Capital Expenditure Reported -183,000 -135,000 -653,000 -556,000 Breakdown 12/31/2017 Operating Cash Flow 2,436,000 Cash Flow from Continuing O... 2,436,000 Net Income from Continuing ... 1,372,000 Operating Gains Losses -687,000 Depreciation Amortization... 290,000 Depreciation & amortiz... 290,000 Depreciation 290,000 Deferred Tax 828,000 Deferred Income Tax 828,000 Asset Impairment Charge Stock based compensation 181,000 Other non-cash items 371,000 81,000 Change in working capital Change in Receivables Change in Inventory Change in Payables And... Change in Payable Change in Tax Paya... Change in Income T... Change in Other Current A... Change in Other Working C... Investing Cash Flow 1,020,000 Cash Flow from Continuing In... 1,020,000 Capital Expenditure Reported -240,000 Net PPE Purchase And Sale 12,000 260,000 395,000 479,000 Purchase of PPE Sale of PPE 12,000 260,000 395,000 479,000 Net Intangibles Purchase ... Purchase of Intangibles Net Business Purchase An... 260,000 395,000 0 Purchase of Business 0 Sale of Business 260,000 395,000 479,000 Net Investment Purchase ... Purchase of Investment Sale of Investment Net Other Investing Changes -16,000 -90,000 -26,000 25,000 Financing Cash Flow -463,000 -1,033,000 -1,508,000 -2,374,000 Cash Flow from Continuing Fi... -463,000 -1,033,000 -1,508,000 -2,374,000 Net Issuance Payments of ... -231,000 -616,000 1,513,000 1,120,000 Net Long Term Debt Is... -381,000 -616,000 1,513,000 1,120,000 Long Term Debt Issuance 1,793,000 3,561,000 2,348,000 1,517,000 Long Term Debt Payments -2,174,000 -4,177,000 -835,000 -397,000 Net Short Term Debt Is... 150,000 Short Term Debt Payme... Net Common Stock Issuan... 2.000 -150,000 -2,253,000 -2,846,000 Common Stock Issuance 2,000 0 7,000 4,000 Common Stock Payments 0 - 150,000 -2,260,000 -2,850,000 Cash Dividends Paid 0 -156,000 -612,000 -543,000 Common Stock Dividend P... -156,000 -612,000 -543,000 Net Other Financing Charges -234,000 -111,000 -156,000 -105,000 End Cash Position 1,421,000 894,000 253,000 360,000 2ol Net PPE Purchase And Sale 1,418,000 Purchase of PPE Sale of PPE 1,418,000 Net Intangibles Purchase ... -189,000 Purchase of Intangibles -189,000 Net Business Purchase An... -189,000 Purchase of Business -189,000 Sale of Business 1,418,000 Net Investment Purchase ... Purchase of Investment Sale of Investment 0 Net Other Investing Changes 31,000 -3.931,000 Financing Cash Flow Cash Flow from Continuing Fi... -3,931,000 Net Issuance Payments of ... -285,000 Net Long Term Debt Iss... -285,000 Long Term Debt Issuance 25,000 Long Term Debt Payments -310,000 Net Short Term Debt Iss... Short Term Debt Payme... Net Common Stock Issuan... -3,007,000 Common Stock Issuance 6,000 Common Stock Payments -3.013,000 Cash Dividends Paid -482.000 Common Stock Dividend P... -482.000 Net Other Financing Charges -157,000 End Cash Position 383,000 Changes in Cash 527,000 641,000 -107,000 -69,000 Beginning Cash Position 894,000 253,000 360,000 429,000 Other Cash Adjustment Outside... Capital Expenditure -183,000 -135,000 -653,000 -556,000 Issuance of Capital Stock 2,000 0 7,000 4,000 Issuance of Debt 1,793,000 3,561,000 2,348,000 1,517,000 Repayment of Debt -2,174,000 -4,177,000 -835,000 -397,000 Repurchase of Capital Stock 0 - 150,000 -2,260,000 -2,850,000 Free Cash Flow 994,000 1,504,000 1,032,000 1,801,000 2017 Non Current Deferred Taxe... 604,000 Non Current Deferred Rev... Other Non Current Liabilities 5,763,000 Total Equity Gross Minority Inte... 3,731,000 Stockholders' Equity 3,731,000 Capital Stock 5,000 Common Stock 5,000 Additional Paid in Capital 5,770,000 Retained Earnings 7,391,000 Treasury Stock 9,418,000 Gains Losses Not Affecting Re... -17,000 Other Equity Interest Minority Interest Total Capitalization 11,571,000 Common Stock Equity 3,731,000 Capital Lease Obligations Net Tangible Assets -14,281,000 Working Capital -3,263,000 Invested Capital 11,969,000 Tangible Book Value -14,281,000 Total Debt 8,238,000 Net Debt 7,855,000 Share Issued 354,800 Ordinary Shares Number 354,800 You have been hired as an independent financial analyst to evaluate the performance of a hospitality corporation. Please choose a company from the list provided on page 3 and answer the following questions after analyzing your company's financial statements. The overall goal of this project is to identify an operational strategy and show its financial viability for the company of your choice. 1. Use the company's last 5 years quarterly or annual historical data to calculate the following (for each of the quarters or years): a. Liquidity ratios - Current ratio, quick (acid) ratio, and working capital. b. Turnover ratios Inventory turnover and asset turnover ratios. c. Solvency ratios Debt ratio, debt to equity ratio, and times interest earned d. Profitability ratios Profit margin. return on assets, and return on equity. e. Investor ratios P/E ratio, dividends payout ratio, and dividend yield. Highly recommend you use tables, charts, graphs, figures, etc. in appendices. Based on the analysis of each ratio category what can you say about the company's financial performance, and what would be your recommendations for each ratio category? 2. What assets did the company invest in over the last five years? How much was the amount of investment for each of the five years? 3. On the basis of your assessment of these investments and company information, what do you think SHOULD be the future strategy of this company? Income Statement All numbers in thousands TTM 12/31/2021 12/31/2020 12/31/2019 Breakdown Total Revenue 13,857,000 13,857,000 10,571,000 20,972,000 Operating Revenue 3,415,000 3,415,000 2,119,000 5,373,000 Cost of Revenue 11,056,000 11,056,000 9,112,000 17,755,000 Gross Profit 2,801,000 2,801,000 1,459,000 3,217,000 1,043,000 1,043,000 1,108,000 1,279,000 Operating Expense Selling General and Administr... 823,000 823,000 762,000 938,000 General & Administrative E... 823,000 823,000 762,000 938,000 Other G and A 823,000 823,000 762,000 938,000 Depreciation Amortization D... 220,000 220,000 346,000 341,000 Depreciation & amortization 220,000 220,000 346,000 341,000 Other Operating Expenses Operating Income 1,758,000 1,758,000 351,000 1,938,000 Net Non Operating Interest Inc... -392,000 -392,000 -418.000 -368,000 Interest Income Non Operating 28,000 28,000 27,000 26,000 Interest Expense Non Operating 420,000 420,000 445,000 394,000 Other Income Expense -186,000 -186,000 -399,000 29,000 Earnings from Equity Interest -24,000 -24,000 -141,000 13,000 Special Income Charges -172,000 -172,000 -267,000 -138,000 8,000 8,000 267,000 138,000 Restructuring & Mergers Acq... Impairment of Capital Assets Other Special Charges 164,000 164,000 -154,000 Other Non Operating Income Ex... 10,000 10,000 9,000 154,000 Pretax Income 1,180,000 1,180,000 -466,000 1,599,000 Tax Provision 81,000 81,000 - 199,000 326,000 Income Statement All numbers in thousands 12/31/2018 12/31/2017 Breakdown Total Revenue 20,758,000 22,894,000 Operating Revenue 5,215,000 5,129,000 Cost of Revenue 17,084,000 19,192,000 Gross Profit 3,674,000 3,702,000 Operating Expense 1,153,000 1,184,000 Selling General and Administr... 927,000 894,000 927,000 894,000 General & Administrative E... Other G and A 927,000 894,000 Depreciation Amortization D... 226,000 290,000 Depreciation & amortization 226,000 290,000 Other Operating Expenses Operating Income 2,521,000 2,518,000 Net Non Operating Interest Inc... -318,000 -250,000 Interest Income Non Operating 22,000 38,000 Interest Expense Non Operating 340,000 288,000 Other Income Expense 142,000 568,000 Earnings from Equity Interest 103,000 39,000 Special Income Charges -155,000 -159,000 Restructuring & Mergers Acq... 155,000 159.000 Impairment of Capital Assets Other Special Charges -194,000 -688,000 Other Non Operating Income Ex... 194,000 688,000 Pretax Income 2,345,000 2,836,000 Tax Provision 438,000 1,464,000 Net Income 1,099,000 1,099,000 -267,000 1,099,000 1,099,000 -267,000 Net Income Including N... Net Income Continuous ... 1.099,000 1,099,000 -267,000 Net Income Discontinuo... Net Income Extraordinary Minority Interests Diluted NI Available to Com Sto... 1,099,000 1,099,000 -267,000 Basic EPS -0.82 Diluted EPS -0.82 325,800 Basic Average Shares Diluted Average Shares 325,800 Total Operating Income as Repo... 1,750,000 1,750,000 84,000 Total Expenses 12,099,000 12,099,000 10,220,000 Net Income from Continuing & .. 1,099,000 1,099,000 -267,000 Normalized Income 1,259,304 1,259,304 -72,090 Interest Income 28,000 28,000 27,000 Interest Expense 420,000 420,000 445,000 Net Interest Income -392,000 -392,000 -418,000 EBIT 1,600,000 1,600,000 -21,000 EBITDA 1,895,000 Reconciled Cost of Revenue 10,981,000 10,981,000 8,980,000 295,000 295,000 478,000 Reconciled Depreciation Net Income from Continuing Op... 1,099,000 1,099,000 -267,000 Total Unusual Items Excluding G... -172,000 -172,000 -267,000 Total Unusual Items -172,000 -172,000 -267,000 Net Income Common Stockh... 1,273,000 1,907,000 1,372.000 Net Income 1,273,000 1,907,000 1,372,000 Net Income Including N... 1,273,000 1,907,000 1,372,000 Net Income Continuous ... 1,273,000 1,907,000 1,372,000 Net Income Discontinuo... Net Income Extraordinary Minority Interests Diluted NI Available to Com Sto... 1,273,000 1,907,000 1,372,000 Basic EPS 3.83 3.89 Diluted EPS 3.80 3.84 Basic Average Shares 332,700 375,200 Diluted Average Shares 335,500 379,900 Total Operating Income as Repo... 1,800,000 2,366,000 2,359,000 Total Expenses 19,034.000 18,237,000 20,376,000 1,273,000 1,907,000 1,372,000 Net Income from Continuing &... Normalized Income 1,382,848 2,033,015 1,467,400 Interest Income 26,000 22,000 38,000 Interest Expense 394,000 340,000 288,000 Net Interest Income -368,000 -318,000 -250,000 EBIT 1,993,000 2,685,000 3,124,000 EBITDA Reconciled Cost of Revenue 17,693,000 17,026,000 19,192,000 Reconciled Depreciation 403,000 284,000 290,000 Net Income from Continuing Op... 1,273,000 1,907,000 1,372,000 Total Unusual Items Excluding G... -138,000 -155,000 -159,000 Total Unusual Items -138,000 -155,000 -159,000 Normalized EBITDA 2,067,000 2,067,000 724,000 Tax Rate for Calcs 0 0 0 Tax Effect of Unusual Items -11,696 -11,696 -72,090 Normalized EBITDA 2.534,000 3,124,000 3,573,000 Tax Rate for Calcs 0 0 0 Tax Effect of Unusual Items -28,152 -28,985 -63,600 12/31/2021 12/31/2020 12/31/2019 12/31/2018 Breakdown Total Assets 25,553,000 24,701,000 25,051,000 23,696,000 Current Assets 3,626,000 2,825,000 3,127,000 2,706,000 Cash, Cash Equivalents & S... 1,393,000 877,000 225,000 316,000 Cash And Cash Equivale... 1,393,000 877,000 225,000 316,000 Cash 225,000 Receivables 1,982,000 1,768,000 2,395,000 2,133,000 Accounts receivable 1,982,000 1,768,000 2,395,000 2,133,000 Inventory 251,000 172.000 252,000 249,000 Prepaid Assets Current Deferred Assets Current Deferred Taxes A... Assets Held for Sale Current 8,000 255,000 8,000 Other Current Assets Total non-current assets 21,927,000 21,876,000 21,924,000 20,990,000 Net PPE 2,565,000 2,266,000 2,792,000 1,956,000 Gross PPE 3,415,000 3,154,000 4,093,000 3,473,000 Properties 0 0 0 0 Land And Improvements 686,000 688,000 684,000 591,000 Buildings And Improvem... 985,000 1,045,000 1,100,000 1,275,000 Machinery Furniture Equ... 545,000 640,000 1,225,000 1,439,000 Other Properties 1,062,000 752,000 888,000 Construction in Progress 137,000 29,000 196,000 168,000 Accumulated Depreciation -850,000 -888,000 -1,301,000 -1,517,000 Goodwill And Other Intang... 17,999,000 18,164,000 17,689,000 17,419,000 Breakdown 12/31/2017 Total Assets 23,948,000 Current Assets 2,747,000 Cash, Cash Equivalents & S... 383,000 Cash And Cash Equivale... 383,000 Cash Receivables 1,991,000 Accounts receivable 1,991,000 Inventory Prepaid Assets 224,000 Current Deferred Assets Current Deferred Taxes As... Assets Held for Sale Current 149,000 Other Current Assets Total non-current assets 21,201,000 Net PPE 1,793,000 Gross PPE 2,890,000 Properties 0 Land And Improvements 601,000 Buildings And Improvem... 1,052,000 Machinery Furniture Equ... 1,121,000 Other Properties Construction in Progress 116,000 Accumulated Depreciation -1,097,000 Goodwill And Other Intang... 18,012,000 2027 2020 2019 2018 8 Goodwill 9,073,000 9,175,000 9,048,000 9,039,000 Other Intangible Assets 8,926,000 8,989,000 8,641,000 8,380,000 Investments And Advances 387,000 422,000 577,000 732,000 Investment in Financial Ass... Non Current Note Receivables 144,000 159.000 117,000 125,000 Non Current Deferred As... 228,000 249,000 154.000 171,000 Non Current Deferred Taxe... 228,000 249,000 154,000 171.000 Other Non Current Assets 604.000 616,000 595,000 587,000 Total Liabilities Net Minority Int... 24,139,000 24,271,000 24,348,000 21,471,000 Current Liabilities 6,407,000 5,752,000 6,677,000 6,437,000 Payables And Accrued Exp... 3,080,000 2,810,000 3,442,000 3,075,000 Payables 726,000 527,000 720,000 767,000 Accounts Payable 726,000 527,000 720,000 767,000 Other Payable Current Accrued Expenses 2,354,000 2,283,000 2,722,000 2,308,000 Pension & Other Post Retirem... Current Debt And Capital ... 805,000 1,173,000 977,000 833,000 Current Debt 805,000 1,173,000 977,000 833,000 Current Deferred Liabilities Current Deferred Revenue Other Current Liabilities 2,522,000 1,769,000 2,258,000 2,529,000 Total Non Current Liabilities ... 17,732,000 18,519,000 17,671,000 15,034,000 Long Term Debt And Capit... 10,431,000 10,026,000 10,845,000 8,514,000 Long Term Debt 9,333,000 9,203,000 9,963,000 8,514,000 Long Term Capital Lease O... 1,098,000 823,000 882,000 201 Goodwill 9,207,000 8,805,000 Other Intangible Assets Investments And Advances 740,000 Investment in Financial Ass... Non Current Note Receivables 142.000 Non Current Deferred As... 93,000 Non Current Deferred Taxe... 93,000 Other Non Current Assets 421,000 Total Liabilities Net Minority Int... 20,217,000 Current Liabilities 6,010,000 Payables And Accrued Exp... 3,548,000 Payables 780,000 Accounts Payable 780,000 Other Payable Current Accrued Expenses 2,768,000 Pension & Other Post Retirem... Current Debt And Capital ... 398,000 Current Debt 398,000 Current Deferred Liabilities Current Deferred Revenue Other Current Liabilities 2,064,000 Total Non Current Liabilities... 14,207,000 Long Term Debt And Capit... 7,840,000 Long Term Debt 7,840,000 Long Term Capital Lease O... 2021 2020 2019 2018 Non Current Deferred Liab... 1,350,000 1,625,000 1,130,000 1,216,000 Non Current Deferred Taxe... 169,000 83,000 290,000 485,000 Non Current Deferred Rev... 1,181,000 1,542,000 840,000 731,000 Other Non Current Liabilities 5,951,000 6,868,000 5,696,000 5,304,000 Total Equity Gross Minority Inte... 1,414,000 430,000 703,000 2,225,000 Stockholders' Equity 1,414,000 430,000 703,000 2,225,000 Capital Stock 5,000 5,000 5,000 5,000 Common Stock 5,000 5,000 5,000 5,000 Additional Paid in Capital 5,892,000 5,851,000 5,800,000 5,814,000 Retained Earnings 10,305,000 9,206,000 9,644,000 8,982,000 Treasury Stock 14,446,000 14,497,000 14,385,000 12,185,000 Gains Losses Not Affecting Re... -342,000 -135,000 -361,000 -391,000 Other Equity Interest Minority Interest Total Capitalization 10,747,000 9,633,000 10,666,000 10,739,000 Common Stock Equity 1,414,000 430,000 703,000 2,225,000 Capital Lease Obligations 1,098,000 823,000 882,000 Net Tangible Assets -16,585,000 -17,734,000 -16,986,000 -15,194,000 Working Capital -2.781,000 -2,927,000 -3,550,000 -3,731,000 Invested Capital 11,552,000 10,806,000 11,643,000 11,572,000 Tangible Book Value -16,585,000 -17,734,000 -16,986,000 -15,194,000 Total Debt 11,236,000 11,199,000 11,822,000 9,347,000 Net Debt 8,745,000 9,499,000 10,715,000 9,031,000 Share Issued 325,700 324,400 324,200 334,100 Ordinary Shares Number 325,700 324,400 324,200 334,100 2017 Non Current Deferred Taxe... 604,000 Non Current Deferred Rev... Other Non Current Liabilities 5,763,000 Total Equity Gross Minority Inte... 3,731,000 Stockholders' Equity 3,731,000 Capital Stock 5,000 Common Stock 5,000 Additional Paid in Capital 5,770,000 Retained Earnings 7,391,000 Treasury Stock 9,418,000 Gains Losses Not Affecting Re... -17,000 Other Equity Interest Minority Interest Total Capitalization 11,571,000 Common Stock Equity 3,731,000 Capital Lease Obligations Net Tangible Assets -14,281,000 Working Capital -3,263,000 Invested Capital 11,969,000 Tangible Book Value -14,281,000 Total Debt 8,238,000 Net Debt 7,855,000 Share Issued 354,800 Ordinary Shares Number 354,800 Breakdown 12/31/2021 12/31/2020 12/31/2019 12/31/2018 Operating Cash Flow 1,177,000 1,639,000 1,685,000 2,357,000 Cash Flow from Continuing O... 1,177,000 1,639,000 1,685,000 2,357,000 Net Income from Continuing ... 1,099,000 -267,000 1,273,000 1,907,000 Operating Gains Losses 161,000 3,000 -147,000 -194,000 Depreciation Amortization... 295,000 478,000 403,000 284,000 Depreciation & amortiz... 295,000 478,000 403,000 284,000 Depreciation 295,000 478,000 403,000 284,000 Deferred Tax -281,000 -478,000 -200,000 -239,000 Deferred Income Tax -281,000 -478,000 -200,000 -239,000 Asset Impairment Charge Stock based compensation 182,000 201,000 187,000 184,000 Other non-cash items -389,000 1,730,000 442,000 491,000 110,000 -28,000 -273,000 -76,000 Change in working capital Change in Receivables Change in Inventory Change in Payables And... Change in Payable Change in Tax Paya... Change in Income T... Change in Other Current A... Change in Other Working C... Investing Cash Flow -187,000 35,000 -284,000 -52,000 Cash Flow from Continuing In... -187,000 35.000 -284,000 -52,000 Capital Expenditure Reported -183,000 -135,000 -653,000 -556,000 Breakdown 12/31/2017 Operating Cash Flow 2,436,000 Cash Flow from Continuing O... 2,436,000 Net Income from Continuing ... 1,372,000 Operating Gains Losses -687,000 Depreciation Amortization... 290,000 Depreciation & amortiz... 290,000 Depreciation 290,000 Deferred Tax 828,000 Deferred Income Tax 828,000 Asset Impairment Charge Stock based compensation 181,000 Other non-cash items 371,000 81,000 Change in working capital Change in Receivables Change in Inventory Change in Payables And... Change in Payable Change in Tax Paya... Change in Income T... Change in Other Current A... Change in Other Working C... Investing Cash Flow 1,020,000 Cash Flow from Continuing In... 1,020,000 Capital Expenditure Reported -240,000 Net PPE Purchase And Sale 12,000 260,000 395,000 479,000 Purchase of PPE Sale of PPE 12,000 260,000 395,000 479,000 Net Intangibles Purchase ... Purchase of Intangibles Net Business Purchase An... 260,000 395,000 0 Purchase of Business 0 Sale of Business 260,000 395,000 479,000 Net Investment Purchase ... Purchase of Investment Sale of Investment Net Other Investing Changes -16,000 -90,000 -26,000 25,000 Financing Cash Flow -463,000 -1,033,000 -1,508,000 -2,374,000 Cash Flow from Continuing Fi... -463,000 -1,033,000 -1,508,000 -2,374,000 Net Issuance Payments of ... -231,000 -616,000 1,513,000 1,120,000 Net Long Term Debt Is... -381,000 -616,000 1,513,000 1,120,000 Long Term Debt Issuance 1,793,000 3,561,000 2,348,000 1,517,000 Long Term Debt Payments -2,174,000 -4,177,000 -835,000 -397,000 Net Short Term Debt Is... 150,000 Short Term Debt Payme... Net Common Stock Issuan... 2.000 -150,000 -2,253,000 -2,846,000 Common Stock Issuance 2,000 0 7,000 4,000 Common Stock Payments 0 - 150,000 -2,260,000 -2,850,000 Cash Dividends Paid 0 -156,000 -612,000 -543,000 Common Stock Dividend P... -156,000 -612,000 -543,000 Net Other Financing Charges -234,000 -111,000 -156,000 -105,000 End Cash Position 1,421,000 894,000 253,000 360,000 2ol Net PPE Purchase And Sale 1,418,000 Purchase of PPE Sale of PPE 1,418,000 Net Intangibles Purchase ... -189,000 Purchase of Intangibles -189,000 Net Business Purchase An... -189,000 Purchase of Business -189,000 Sale of Business 1,418,000 Net Investment Purchase ... Purchase of Investment Sale of Investment 0 Net Other Investing Changes 31,000 -3.931,000 Financing Cash Flow Cash Flow from Continuing Fi... -3,931,000 Net Issuance Payments of ... -285,000 Net Long Term Debt Iss... -285,000 Long Term Debt Issuance 25,000 Long Term Debt Payments -310,000 Net Short Term Debt Iss... Short Term Debt Payme... Net Common Stock Issuan... -3,007,000 Common Stock Issuance 6,000 Common Stock Payments -3.013,000 Cash Dividends Paid -482.000 Common Stock Dividend P... -482.000 Net Other Financing Charges -157,000 End Cash Position 383,000 Changes in Cash 527,000 641,000 -107,000 -69,000 Beginning Cash Position 894,000 253,000 360,000 429,000 Other Cash Adjustment Outside... Capital Expenditure -183,000 -135,000 -653,000 -556,000 Issuance of Capital Stock 2,000 0 7,000 4,000 Issuance of Debt 1,793,000 3,561,000 2,348,000 1,517,000 Repayment of Debt -2,174,000 -4,177,000 -835,000 -397,000 Repurchase of Capital Stock 0 - 150,000 -2,260,000 -2,850,000 Free Cash Flow 994,000 1,504,000 1,032,000 1,801,000 2017 Non Current Deferred Taxe... 604,000 Non Current Deferred Rev... Other Non Current Liabilities 5,763,000 Total Equity Gross Minority Inte... 3,731,000 Stockholders' Equity 3,731,000 Capital Stock 5,000 Common Stock 5,000 Additional Paid in Capital 5,770,000 Retained Earnings 7,391,000 Treasury Stock 9,418,000 Gains Losses Not Affecting Re... -17,000 Other Equity Interest Minority Interest Total Capitalization 11,571,000 Common Stock Equity 3,731,000 Capital Lease Obligations Net Tangible Assets -14,281,000 Working Capital -3,263,000 Invested Capital 11,969,000 Tangible Book Value -14,281,000 Total Debt 8,238,000 Net Debt 7,855,000 Share Issued 354,800 Ordinary Shares Number 354,800


