Answered step by step
Verified Expert Solution
Link Copied!

Question

1 Approved Answer

Below is the list of the components of the depreciation and amortization expense tor the year. How much is likely to be shown in COGS
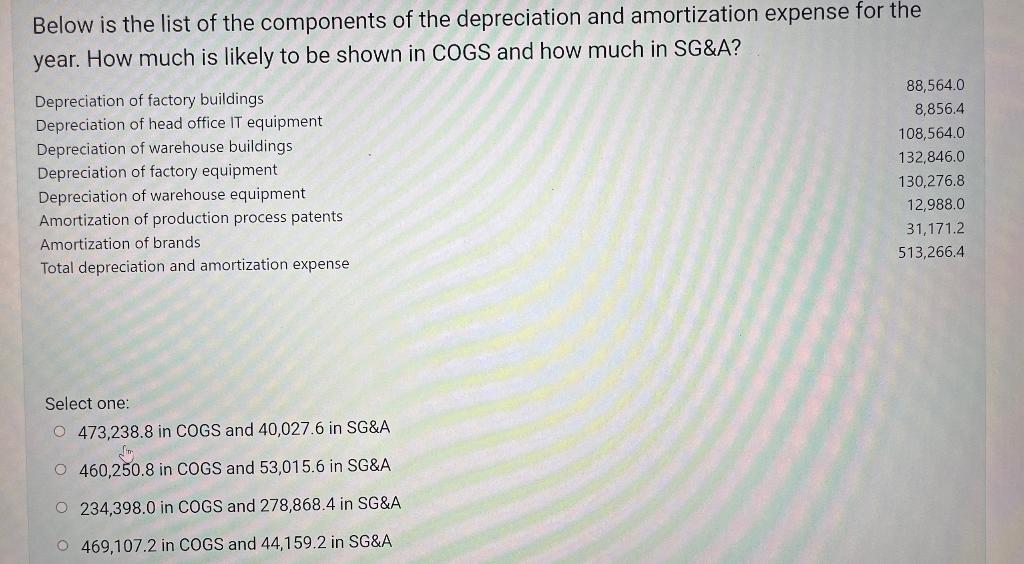
image text in transcribed

Below is the list of the components of the depreciation and amortization expense tor the year. How much is likely to be shown in COGS and how much in SG\&A? Depreciation of factory buildings Depreciation of head office IT equipment Depreciation of warehouse buildings Depreciation of factory equipment Depreciation of warehouse equipment Amortization of production process patents Amortization of brands Total depreciation and amortization expense 88,564.0 8,856.4 108,564.0 132,846.0 130,276.8 12,988.0 31,171.2 513,266.4 Select one: 473,238.8 in COGS and 40,027.6 in SG\&A 460,250.8 in COGS and 53,015.6 in SG\&A 234,398.0 in COGS and 278,868.4 in SG\&A 469,107.2 in COGS and 44,159.2 in SG\&A

Step by Step Solution

There are 3 Steps involved in it

Step: 1

blur-text-image

Get Instant Access to Expert-Tailored Solutions

See step-by-step solutions with expert insights and AI powered tools for academic success

Step: 2

blur-text-image

Step: 3

blur-text-image

Ace Your Homework with AI

Get the answers you need in no time with our AI-driven, step-by-step assistance

Get Started

Recommended Textbook for

Audit Of EPAs Fiscal 2013 And 2012 Consolidated Financial Statements

Authors: U.S. Environmental Protection Agency

1st Edition

1500696218, 978-1500696214

More Books

Students also viewed these Accounting questions