

Answered step by step
Verified Expert Solution
Question
1 Approved Answer
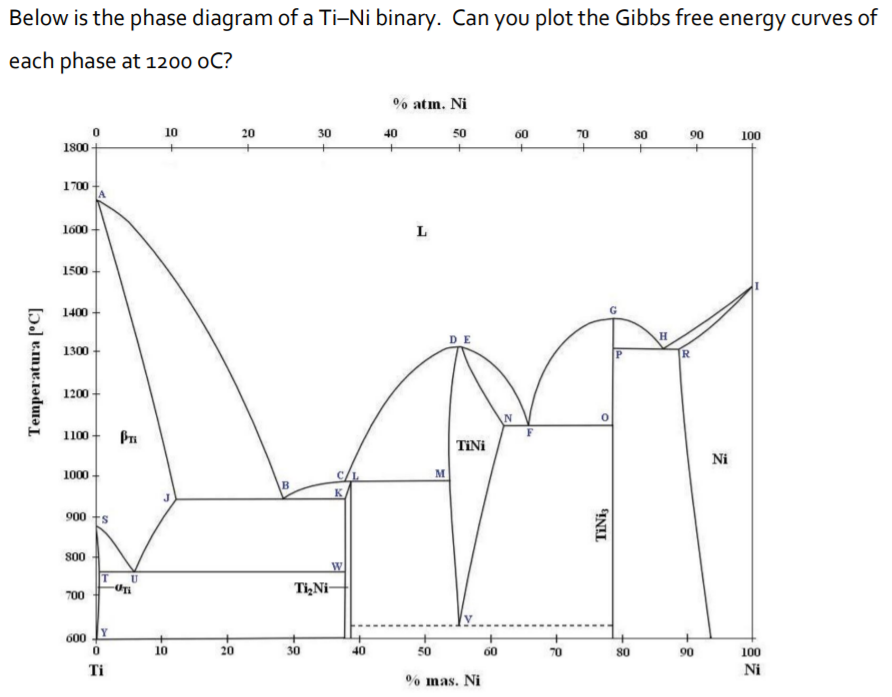
Below is the phase diagram of a Ti-Ni binary. Can you plot the Gibbs free energy curves of each phase at 1200 OC? % atm.
Step by Step Solution
There are 3 Steps involved in it
Step: 1

Get Instant Access to Expert-Tailored Solutions
See step-by-step solutions with expert insights and AI powered tools for academic success
Step: 2

Step: 3
Ace Your Homework with AI
Get the answers you need in no time with our AI-driven, step-by-step assistance
Get Started
Introduction To Engineering Heat Transfer
Authors: G. F. Nellis, S. A. Klein
1st Edition
110717953X, 9781107179530