

Answered step by step
Verified Expert Solution
Question
1 Approved Answer
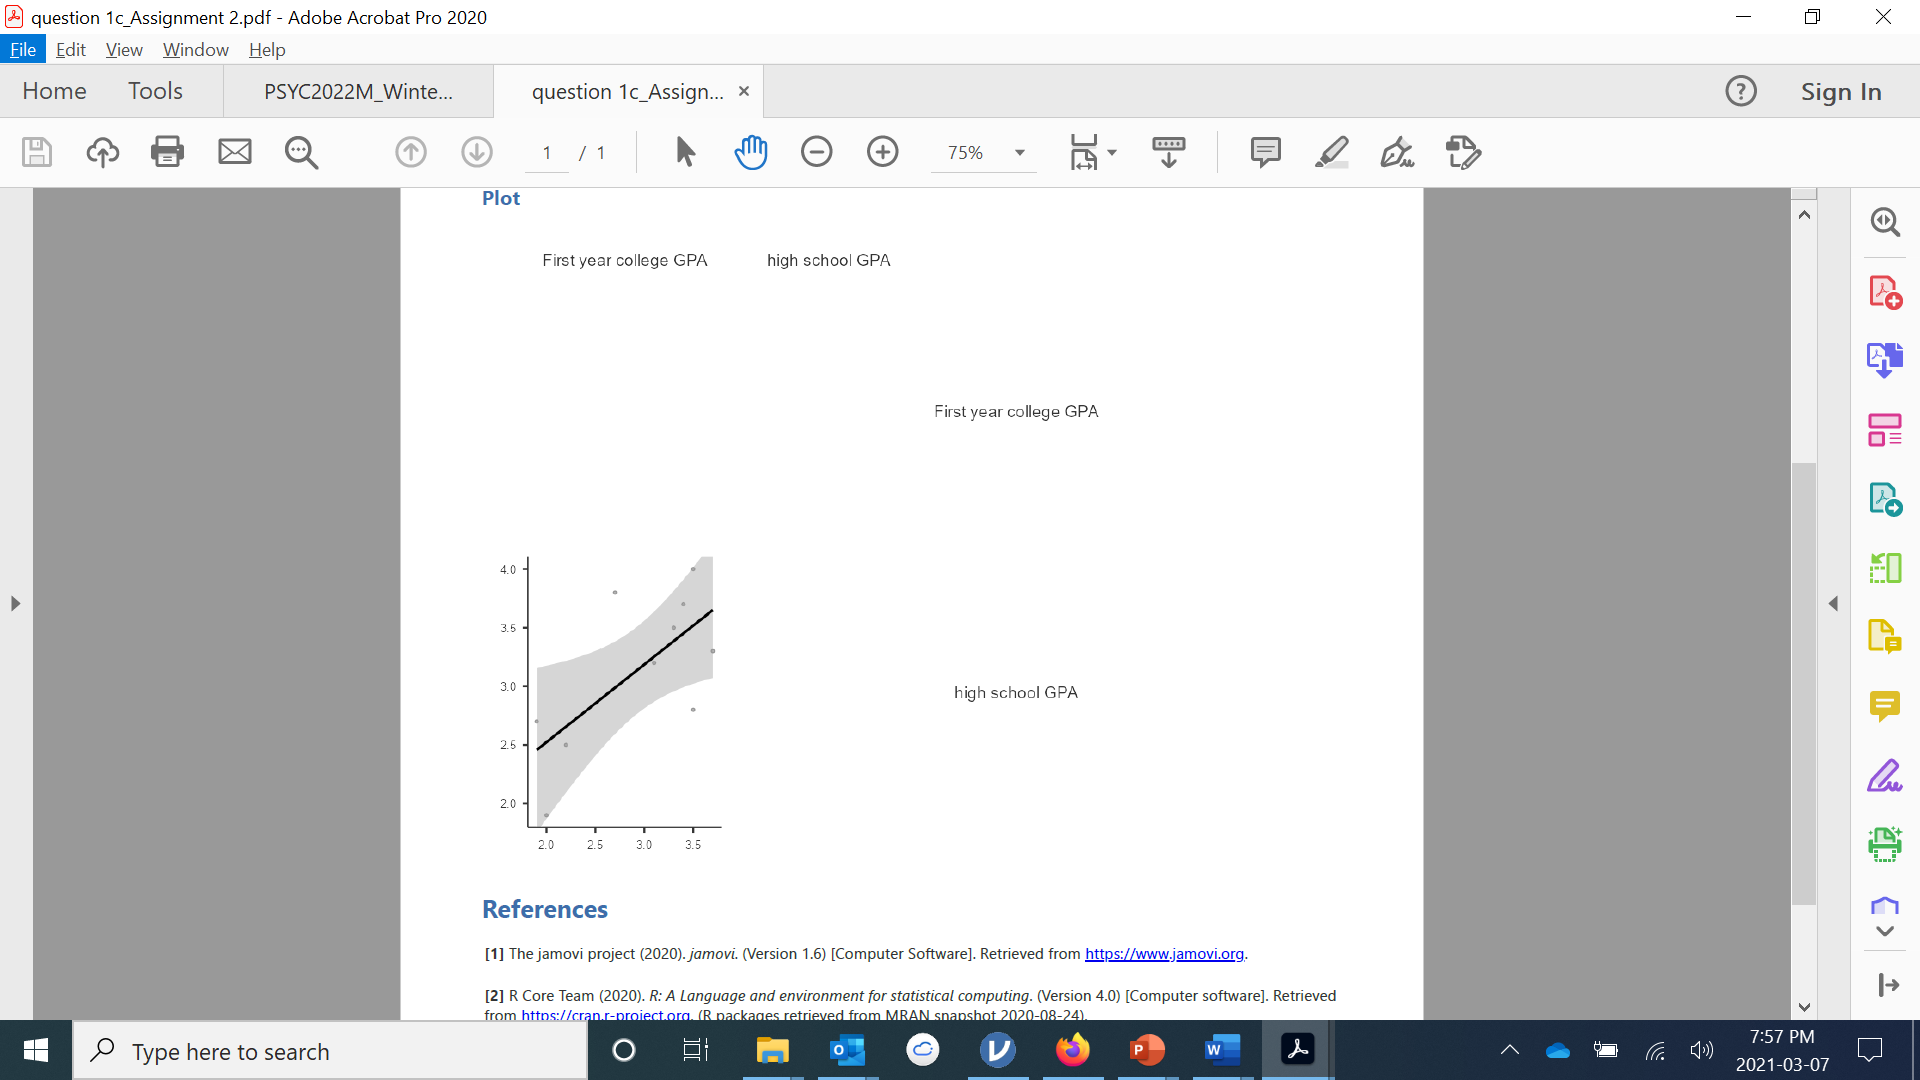
Below shows the linear relationship between first year college GPA and high school GPA For both variables the GPA ranges from 0 to 4 in
- Below shows the linear relationship between first year college GPA and high school GPA For both variables the GPA ranges from 0 to 4 in this sample. However, for the high schools sampled in this region, the true range of GPA is 0 to 5, how might this affect the correlation between these two variables?
Step by Step Solution
There are 3 Steps involved in it
Step: 1

Get Instant Access to Expert-Tailored Solutions
See step-by-step solutions with expert insights and AI powered tools for academic success
Step: 2

Step: 3
Ace Your Homework with AI
Get the answers you need in no time with our AI-driven, step-by-step assistance
Get Started
Geometry And Analysis Of Fractals Hong Kong, December 2012
Authors: De Jun Feng, Ka Sing Lau
1st Edition
3662439204, 9783662439203