

Answered step by step
Verified Expert Solution
Question
1 Approved Answer
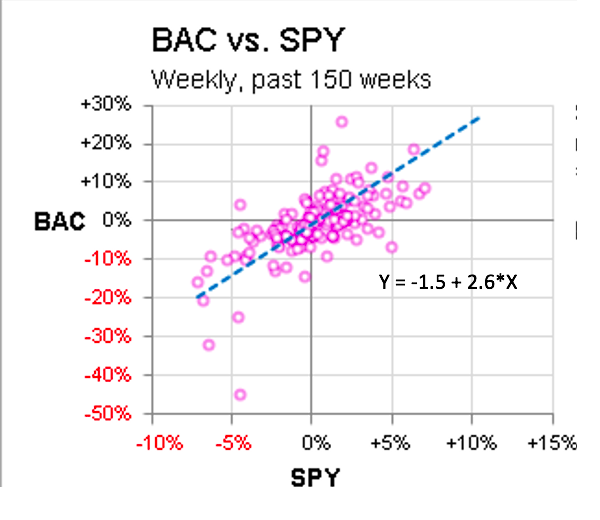
Below you see scatterplot (with the line of the best fit) for monthly returns on the stock of Bank of America (BAC) versus returns on
Below you see scatterplot (with the line of the best fit) for monthly returns on the stock of Bank of America (BAC) versus returns on the SP500 Index.
- Determine beta of equity of BAC
- If market excess return is equal to -10%, estimate expected return on the equity of BAC
Step by Step Solution
There are 3 Steps involved in it
Step: 1

Get Instant Access to Expert-Tailored Solutions
See step-by-step solutions with expert insights and AI powered tools for academic success
Step: 2

Step: 3
Ace Your Homework with AI
Get the answers you need in no time with our AI-driven, step-by-step assistance
Get Started
Financial Valuation Workbook
Authors: James Hitchner, Michael J. Mard
1st Edition
0471220833, 978-0471220831