

Answered step by step
Verified Expert Solution
Question
1 Approved Answer
Benicio wants to compare the sales of each product in 2021 with the sales in 2020. He has the 2020 sales data stored in a
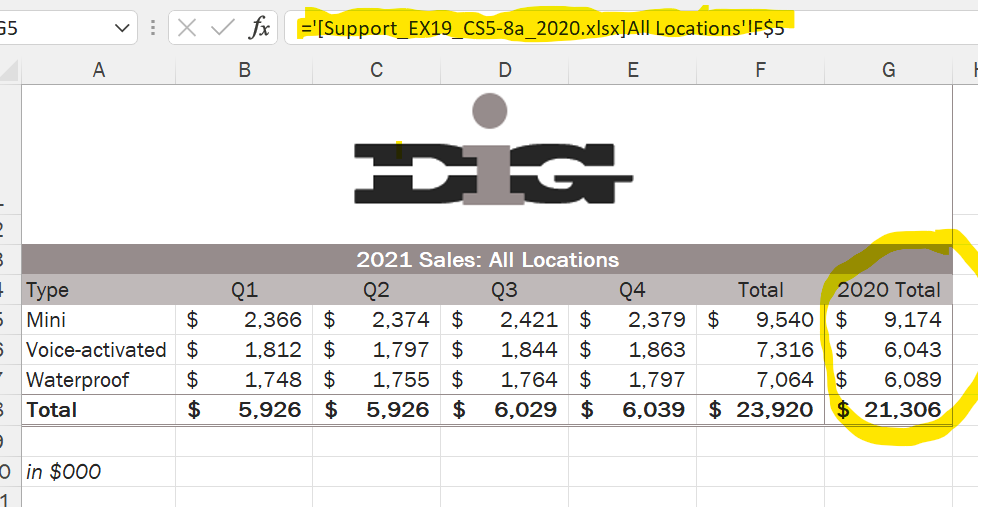
- Benicio wants to compare the sales of each product in 2021 with the sales in 2020. He has the 2020 sales data stored in a separate workbook. Add the 2020 sales data to the All Locations worksheet as follows:
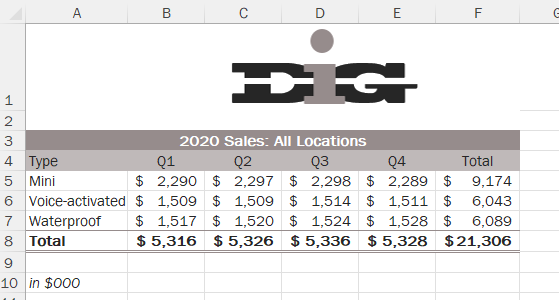
- Open the workbook Support_EX19_CS5-8a_2020.xlsx.
- Return to the All Locations worksheet in the original workbook.
- In cell G5, enter a formula using an external reference to display the total sales of Mini products in 2020 (cell F5).
- In the formula in cell G5, change the absolute reference to a mixed reference, with a relative reference to the row number.
- Fill the range G6:G8 with the formula in cell G5, filling without formatting.
- Close the workbook Support_EX19_CS5-8a_2020.xlsx.
I tried the formula below but its not working
workbook Support_EX19_CS5-8a_2020.xlsx.
Step by Step Solution
There are 3 Steps involved in it
Step: 1

Get Instant Access to Expert-Tailored Solutions
See step-by-step solutions with expert insights and AI powered tools for academic success
Step: 2

Step: 3
Ace Your Homework with AI
Get the answers you need in no time with our AI-driven, step-by-step assistance
Get Started
Production And Operations Analysis
Authors: Steven Nahmias, Tava Lennon Olsen
7th Edition
1478623063, 9781478623069