

Question
Beststyle is a leading clothing brand with multiple retail stores across India. Their outlets are well spread in tier 1 and 2 cities of India.
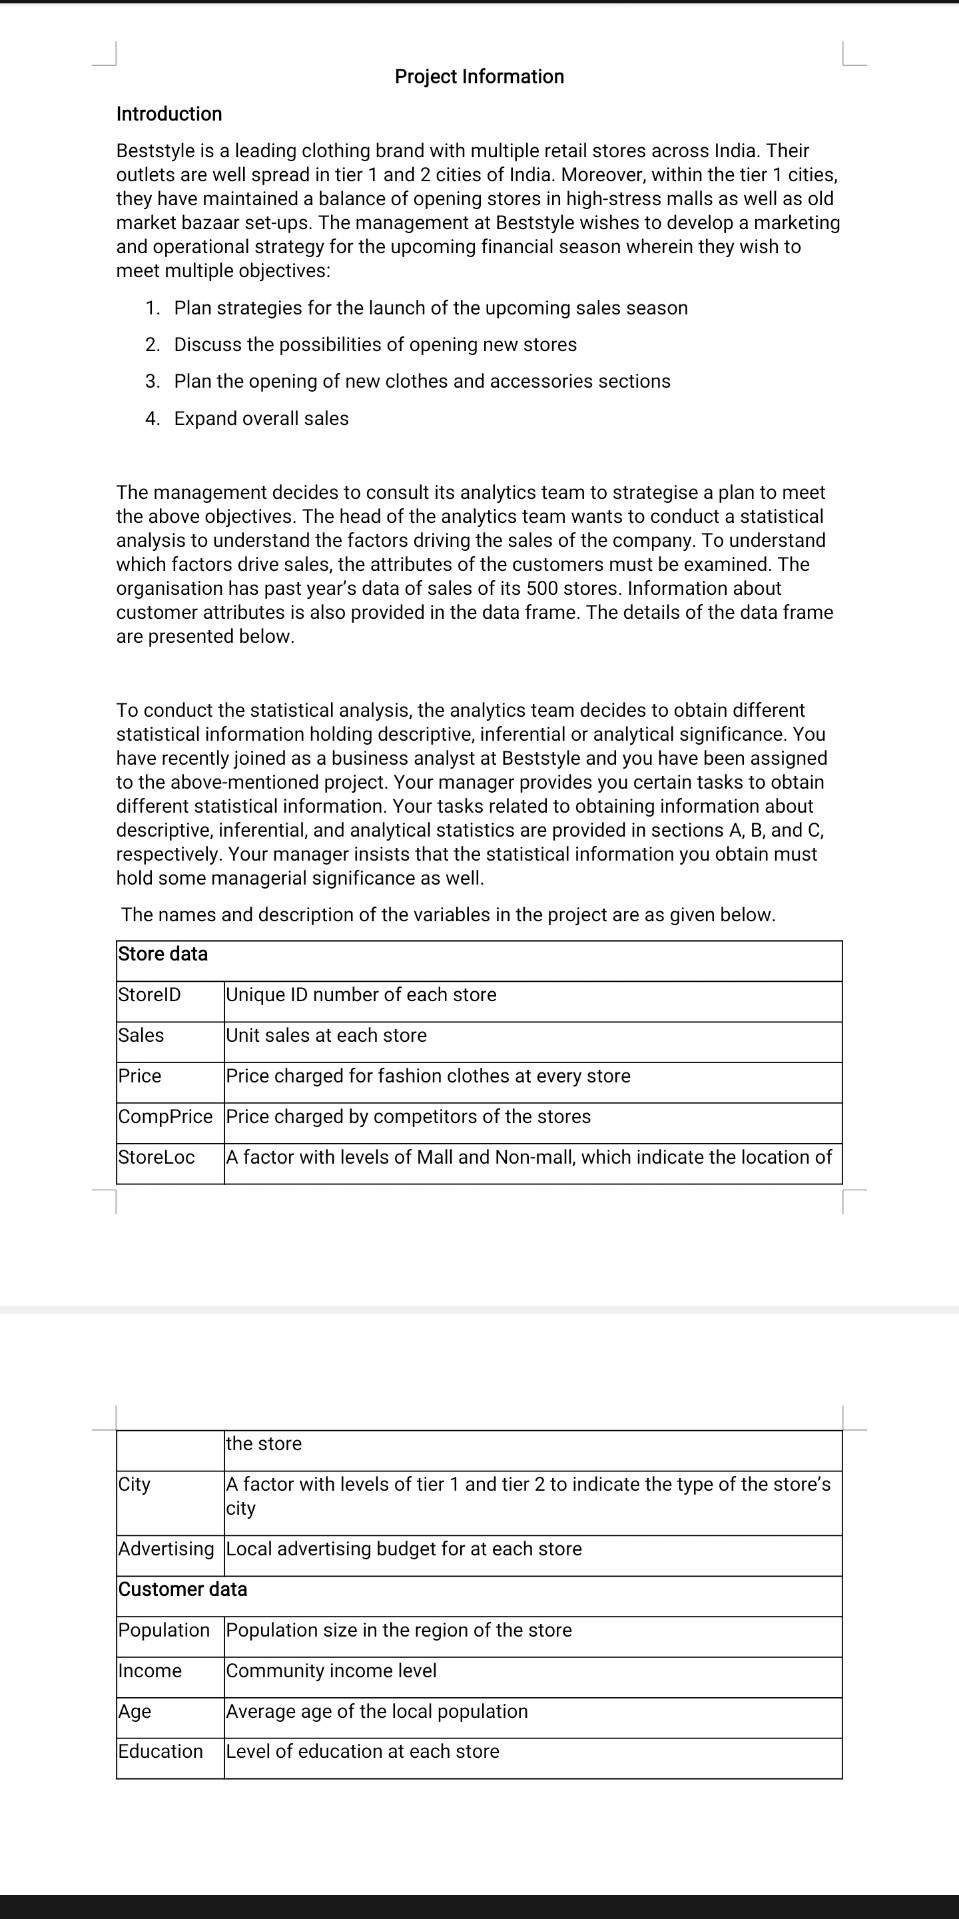
Beststyle is a leading clothing brand with multiple retail stores across India. Their outlets are well spread in tier 1 and 2 cities of India. Moreover, within the tier 1 cities, they have maintained a balance of opening stores in high-stress malls as well as old market bazaar set-ups. The management at Beststyle wishes to develop a marketing and operational strategy for the upcoming financial season wherein they wish to meet multiple objectives:
1. Plan strategies for the launch of the upcoming sales season
2. Discuss the possibilities of opening new stores
3. Plan the opening of new clothes and accessories sections
4. Expand overall sales
The management decides to consult its analytics team to strategise a plan to meet the above objectives. The head of the analytics team wants to conduct a statistical analysis to understand the factors driving the sales of the company. To understand which factors drive sales, the attributes of the customers must be examined. The organisation has past years data of sales of its 500 stores. Information about customer attributes is also provided in the data frame. The details of the data frame are presented below.
To conduct the statistical analysis, the analytics team decides to obtain different statistical information holding descriptive, inferential or analytical significance. You have recently joined as a business analyst at Beststyle and you have been assigned to the above-mentioned project. Your manager provides you certain tasks to obtain different statistical information. Your tasks related to obtaining information about descriptive, inferential, and analytical statistics are provided in sections A, B, and C, respectively. Your manager insists that the statistical information you obtain must hold some managerial significance as well.
| Data.xlsx |
| Project Information.docx |
| R_Script_Submission _Template.R |
| Submission Template.docx |
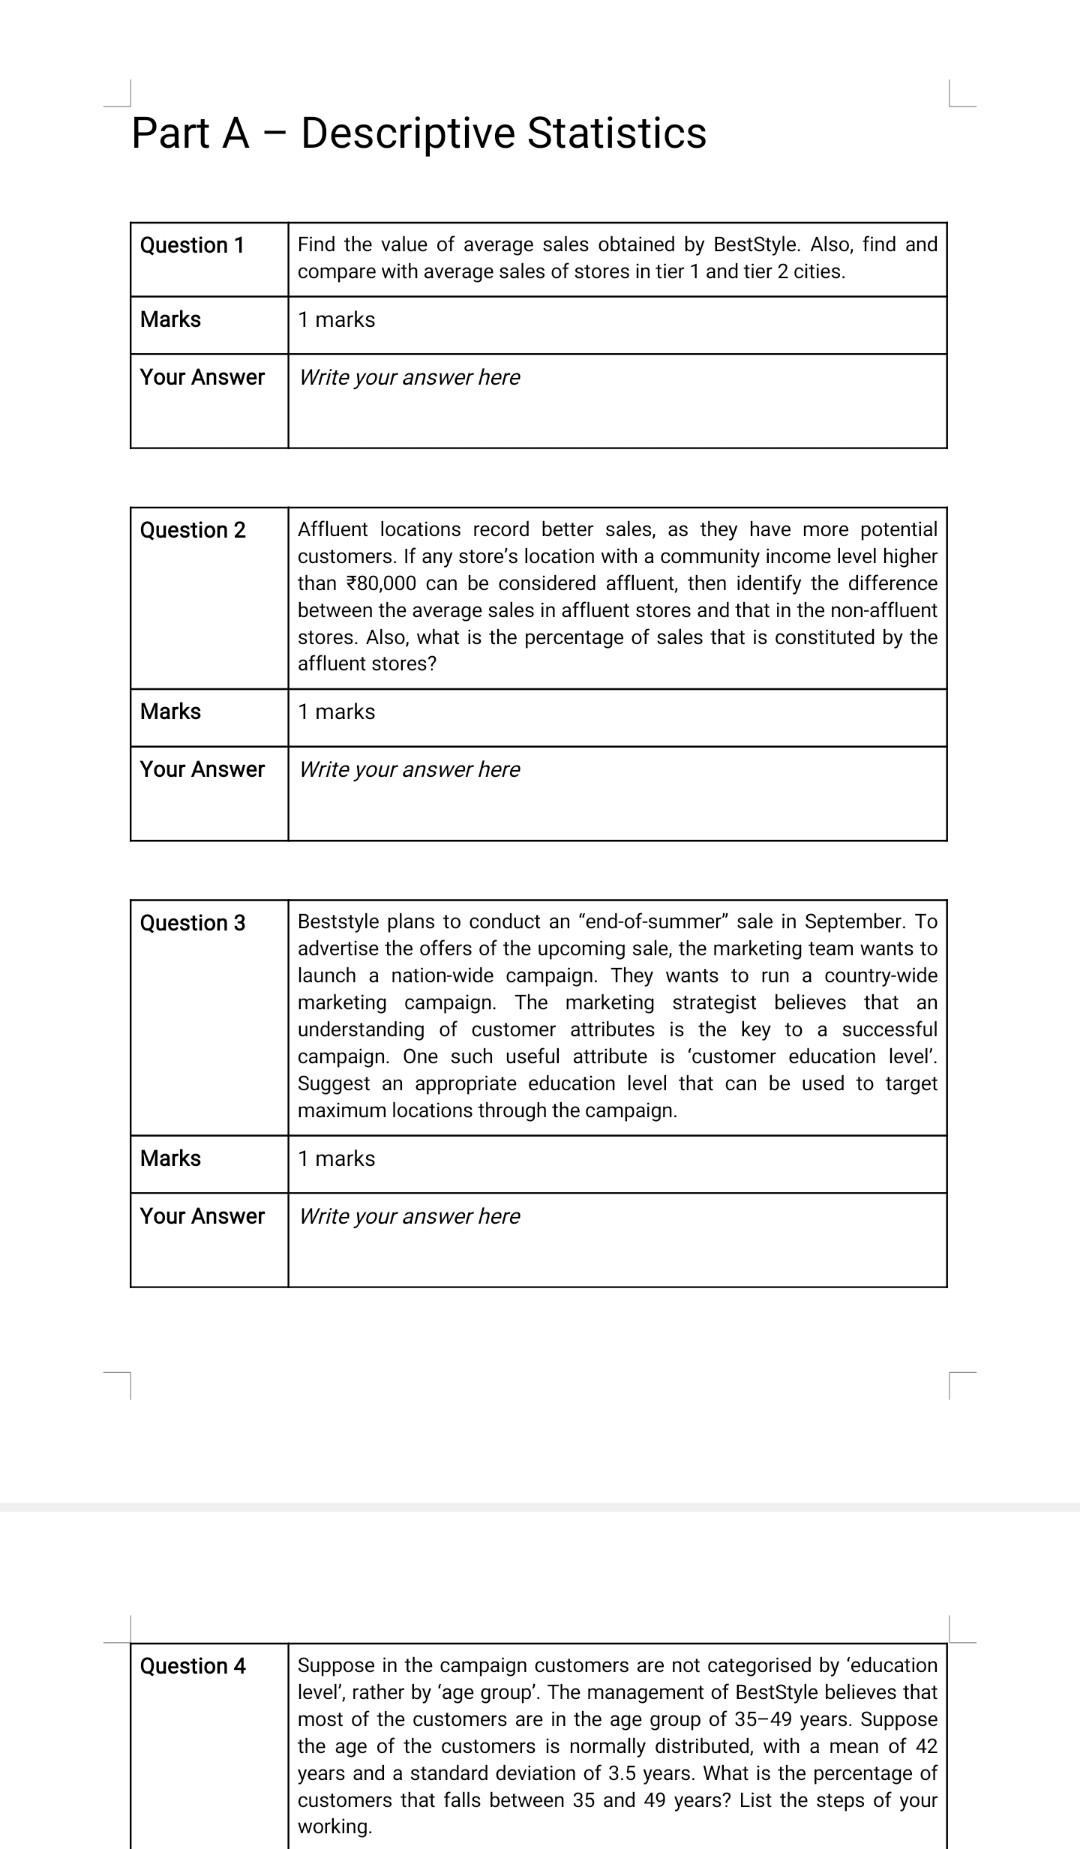
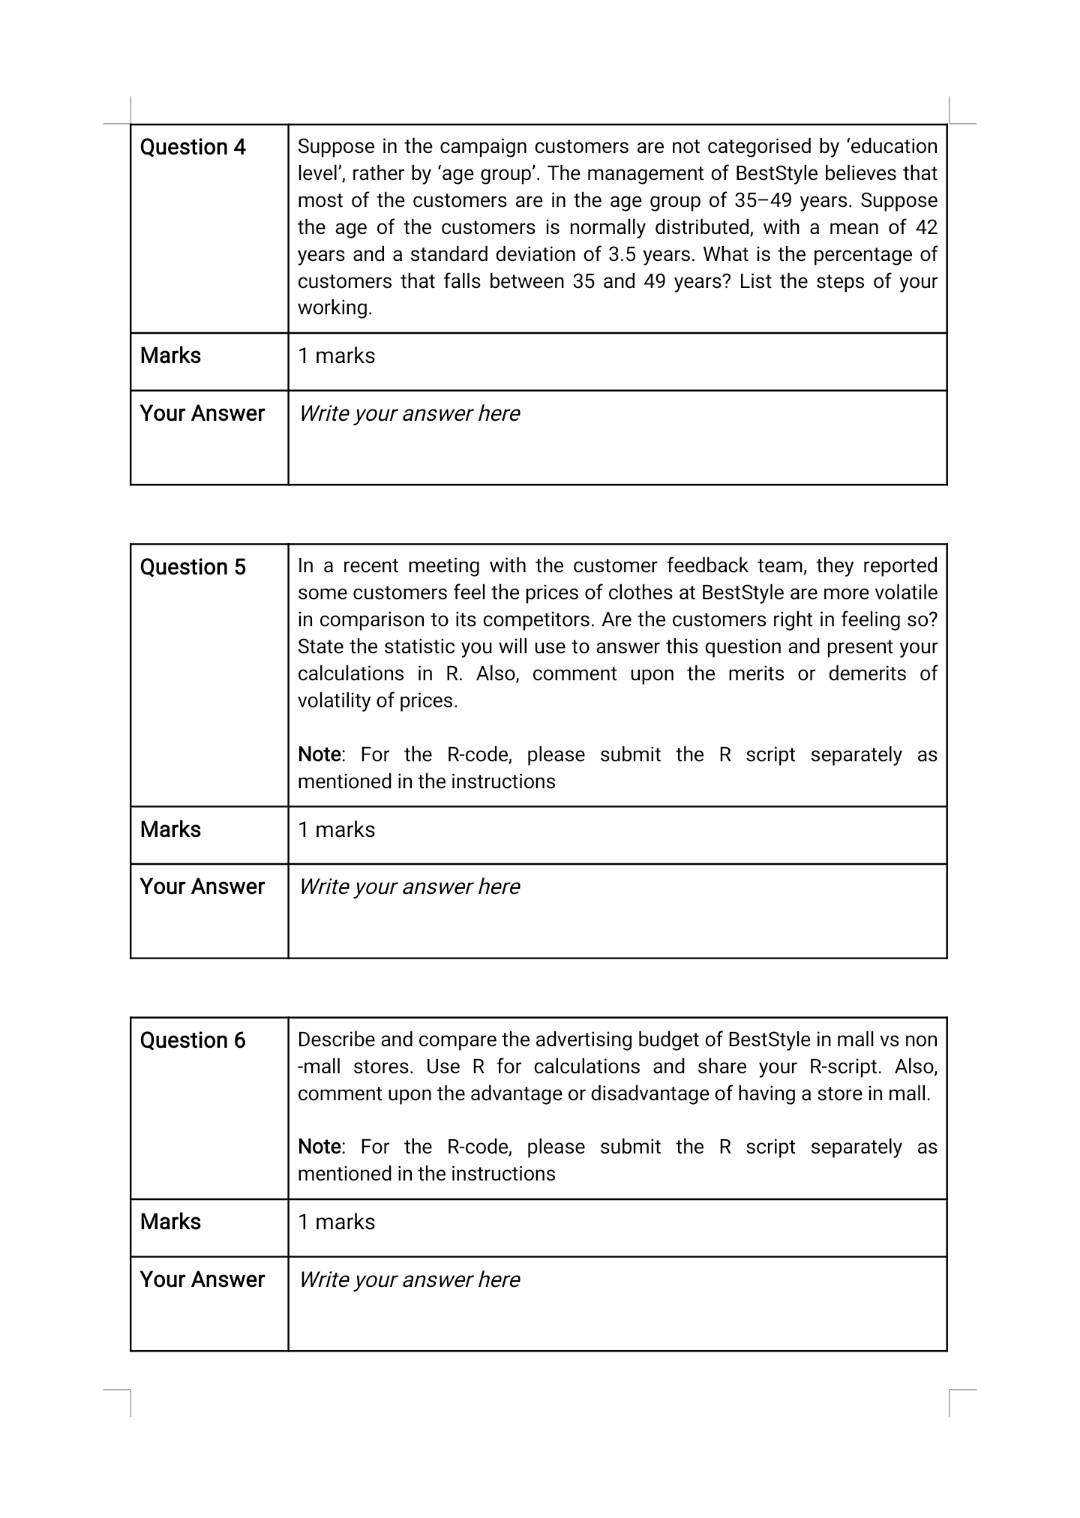
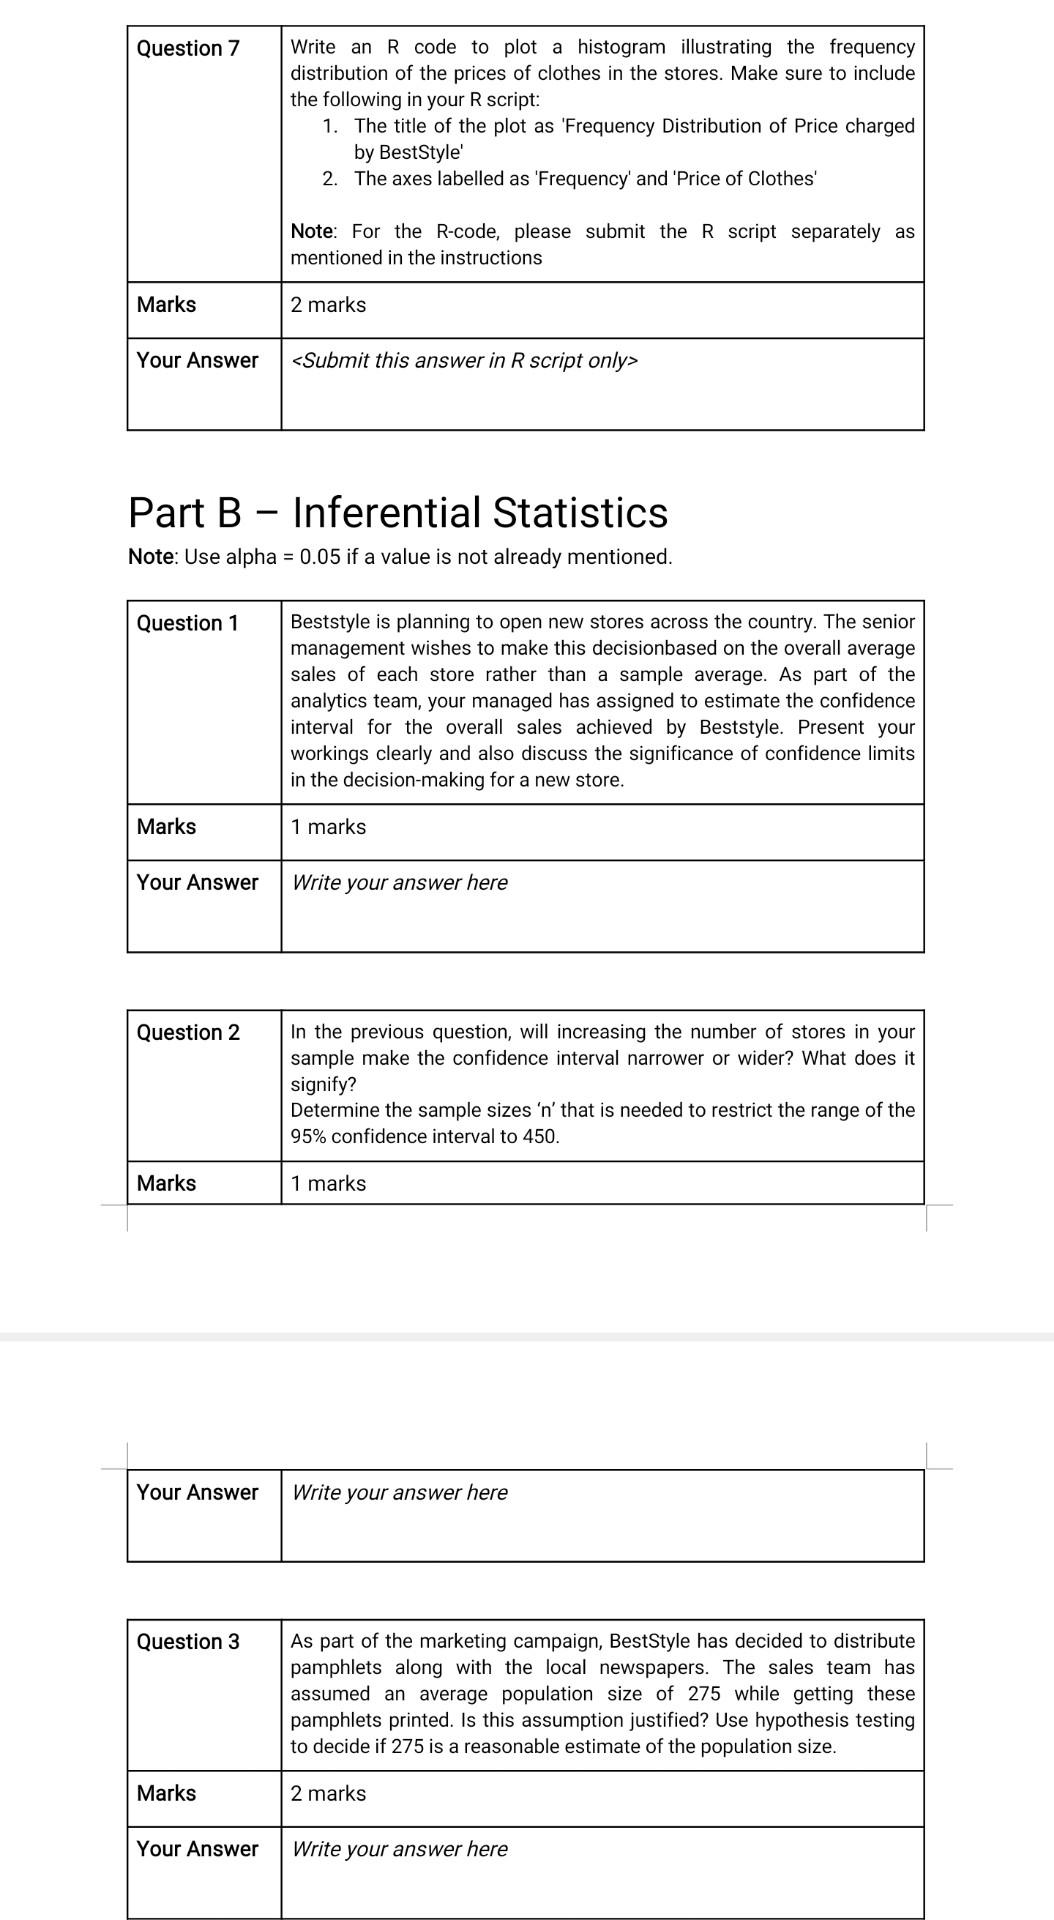
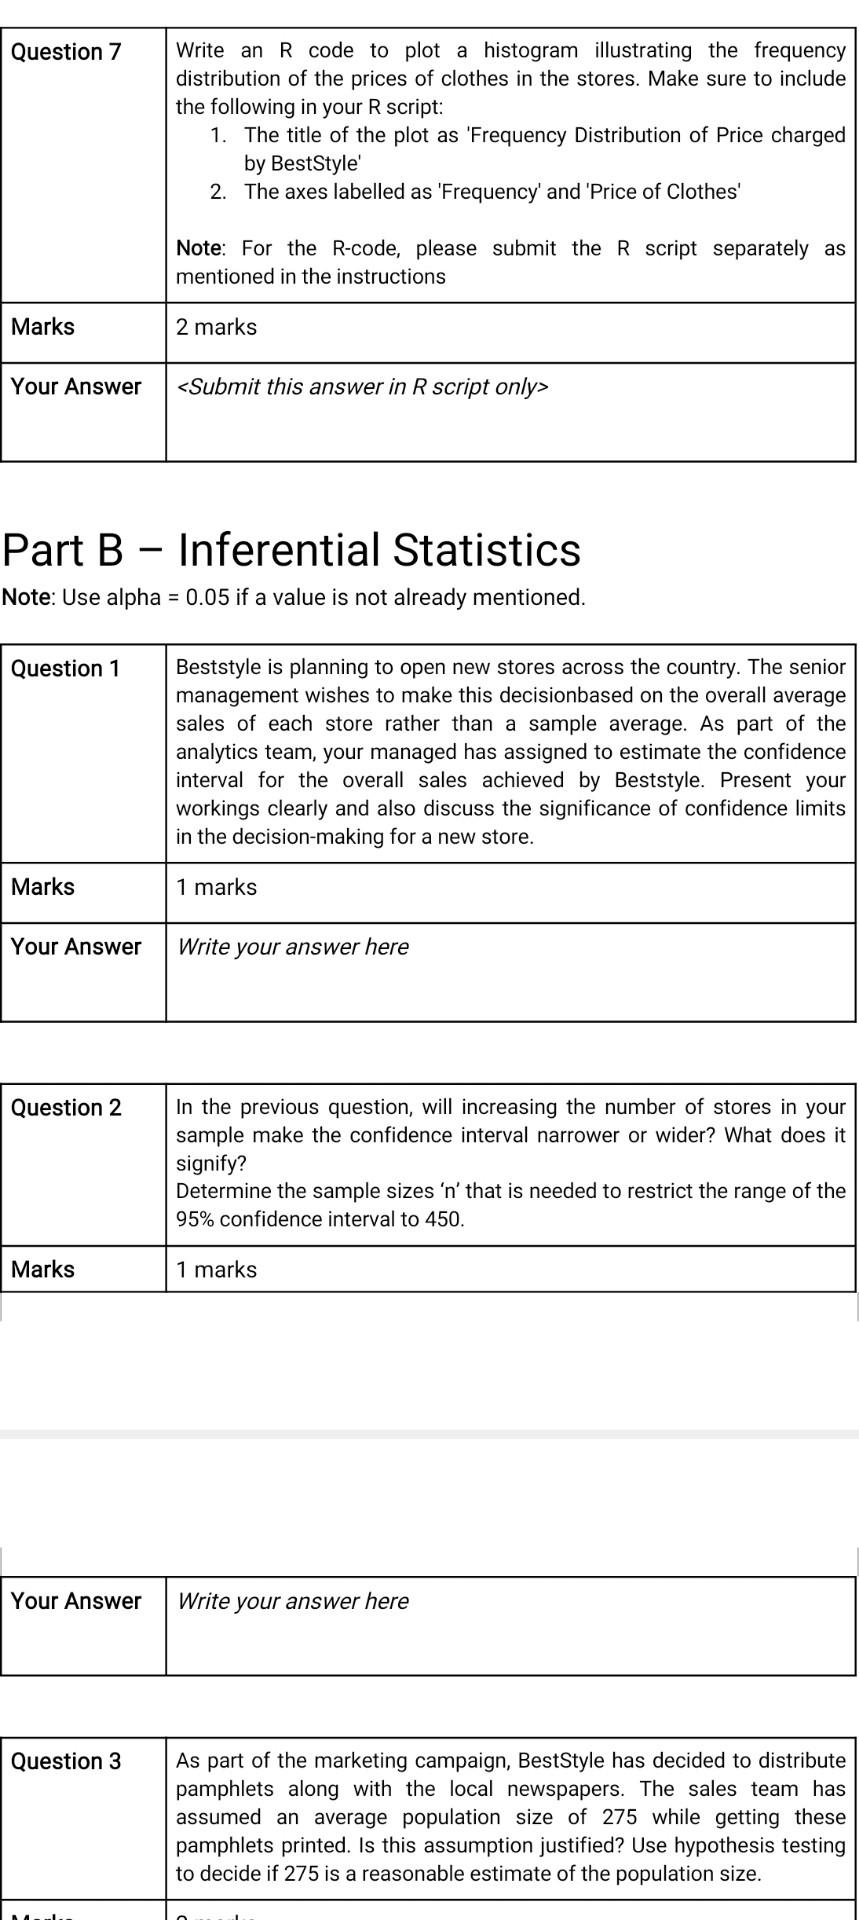

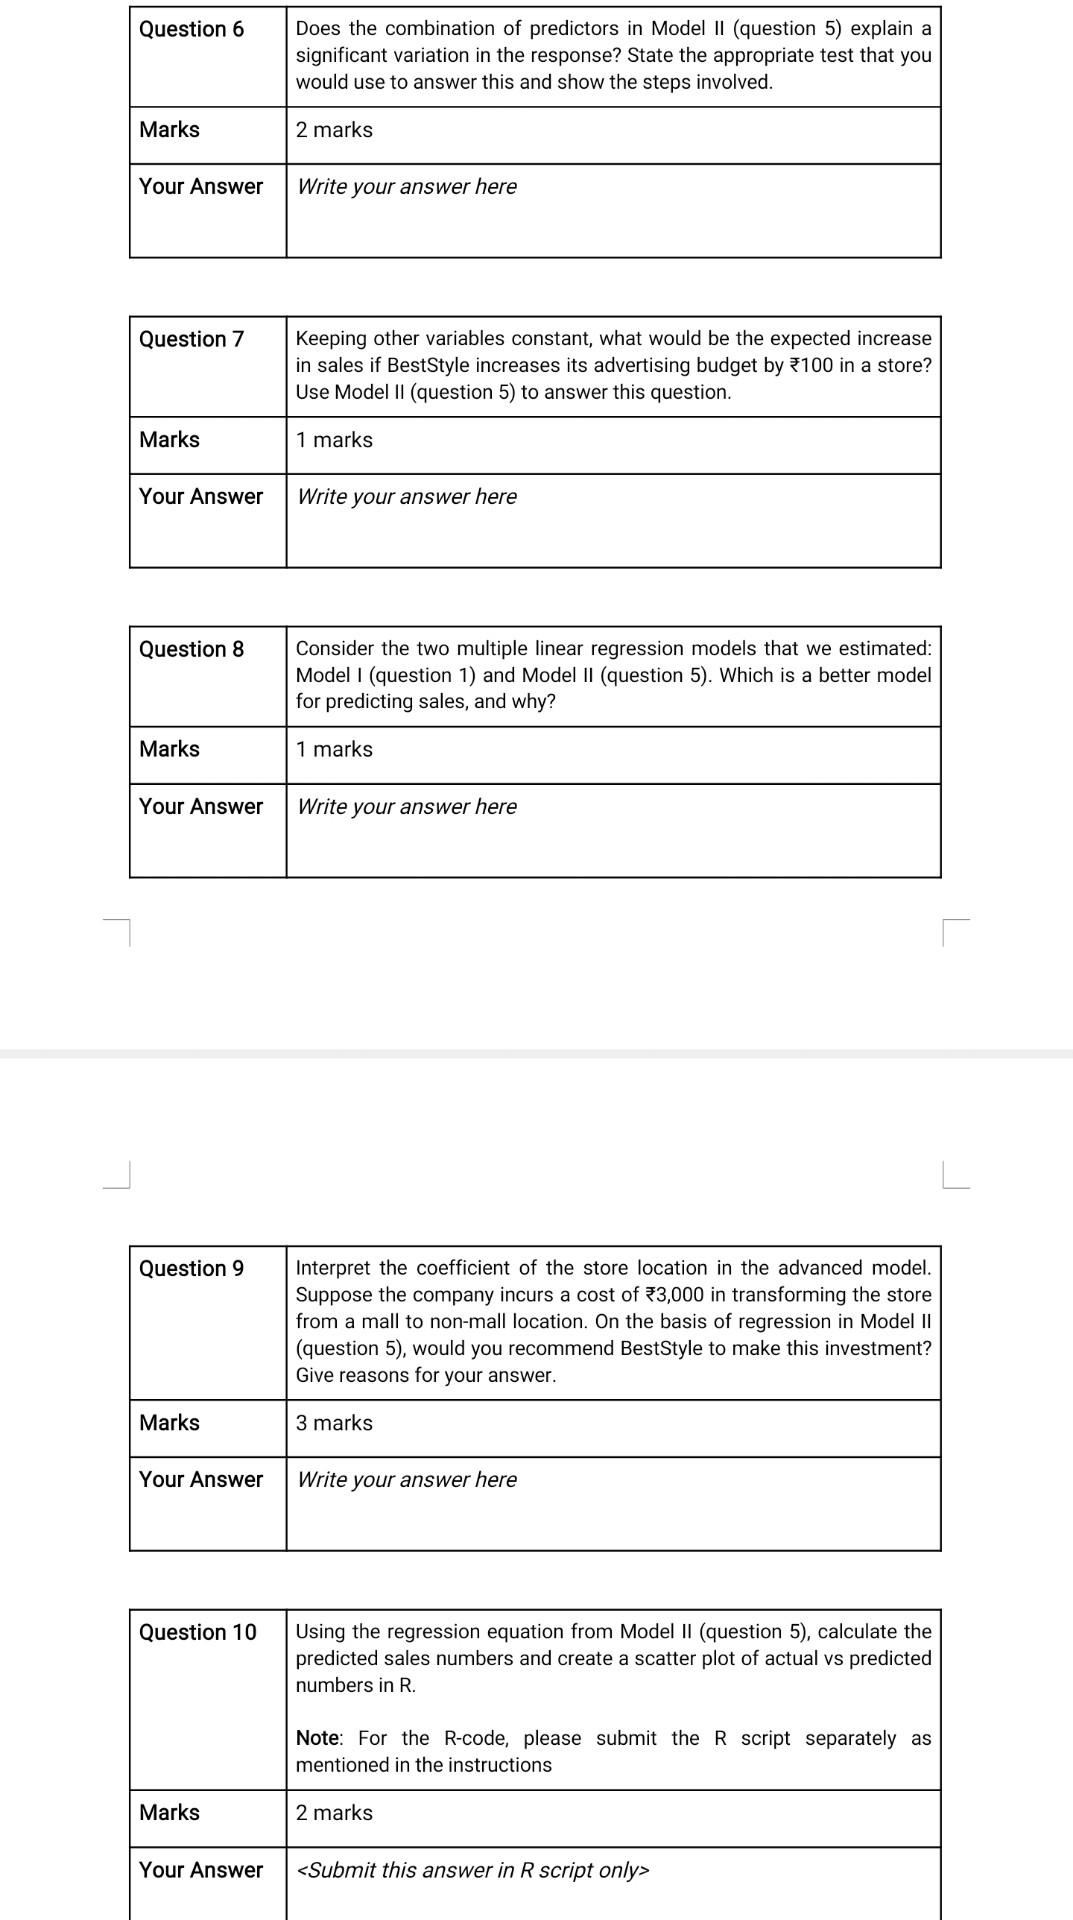
Project Information Introduction Beststyle is a leading clothing brand with multiple retail stores across India. Their outlets are well spread in tier 1 and 2 cities of India. Moreover, within the tier 1 cities, they have maintained a balance of opening stores in high-stress malls as well as old market bazaar set-ups. The management at Beststyle wishes to develop a marketing and operational strategy for the upcoming financial season wherein they wish to meet multiple objectives: 1. Plan strategies for the launch of the upcoming sales season 2. Discuss the possibilities of opening new stores 3. Plan the opening of new clothes and accessories sections 4. Expand overall sales The management decides to consult its analytics team to strategise a plan to meet the above objectives. The head of the analytics team wants to conduct a statistical analysis to understand the factors driving the sales of the company. To understand which factors drive sales, the attributes of the customers must be examined. The organisation has past year's data of sales of its 500 stores. Information about customer attributes is also provided in the data frame. The details of the data frame are presented below. To conduct the statistical analysis, the analytics team decides to obtain different statistical information holding descriptive, inferential or analytical significance. You have recently joined as a business analyst at Beststyle and you have been assigned to the above-mentioned project. Your manager provides you certain tasks to obtain different statistical information. Your tasks related to obtaining information about descriptive, inferential, and analytical statistics are provided in sections A, B, and C, respectively. Your manager insists that the statistical information you obtain must hold some managerial significance as well. The names and description of the variables in the project are as given below. Store data StorelD Unique ID number of each store Sales Unit sales at each store Price Price charged for fashion clothes at every store CompPrice Price charged by competitors of the stores StoreLoc A factor with levels of Mall and Non-mall, which indicate the location of the store City A factor with levels of tier 1 and tier 2 to indicate the type of the store's city Advertising Local advertising budget for at each store Customer data Population Population size in the region of the store Income Community income level Age Average age of the local population Education Level of education at each store Part A Descriptive Statistics - Question 1 Marks Your Answer Question 2 Marks Your Answer Question 3 Marks Your Answer Question 4 Find the value of average sales obtained by BestStyle. Also, find and compare with average sales of stores in tier 1 and tier 2 cities. 1 marks Write your answer here Affluent locations record better sales, as they have more potential customers. If any store's location with a community income level higher than 80,000 can be considered affluent, then identify the difference between the average sales in affluent stores and that in the non-affluent stores. Also, what is the percentage of sales that is constituted by the affluent stores? 1 marks Write your answer here Beststyle plans to conduct an "end-of-summer" sale in September. To advertise the offers of the upcoming sale, the marketing team wants to launch a nation-wide campaign. They wants to run a country-wide marketing campaign. The marketing strategist believes that an understanding of customer attributes is the key to a successful campaign. One such useful attribute is 'customer education level'. Suggest an appropriate education level that can be used to target maximum locations through the campaign. 1 marks Write your answer here Suppose in the campaign customers are not categorised by 'education level', rather by 'age group'. The management of BestStyle believes that most of the customers are in the age group of 35-49 years. Suppose the age of the customers is normally distributed, with a mean of 42 years and a standard deviation of 3.5 years. What is the percentage of customers that falls between 35 and 49 years? List the steps of your working. Question 4 Marks Your Answer Question 5 Marks Your Answer Question 6 Marks Your Answer Suppose in the campaign customers are not categorised by 'education level', rather by 'age group'. The management of BestStyle believes that most of the customers are in the age group of 35-49 years. Suppose the age of the customers is normally distributed, with a mean of 42 years and a standard deviation of 3.5 years. What is the percentage of customers that falls between 35 and 49 years? List the steps of your working. 1 marks Write your answer here In a recent meeting with the customer feedback team, they reported some customers feel the prices of clothes at BestStyle are more volatile in comparison to its competitors. Are the customers right in feeling so? State the statistic you will use to answer this question and present your calculations in R. Also, comment upon the merits or demerits of volatility of prices. Note: For the R-code, please submit the R script separately as mentioned in the instructions 1 marks Write your answer here Describe and compare the advertising budget of BestStyle in mall vs non -mall stores. Use R for calculations and share your R-script. Also, comment upon the advantage or disadvantage of having a store mall. Note: For the R-code, please submit the R script separately as mentioned in the instructions 1 marks Write your answer here Question 7 Write an R code to plot a histogram illustrating the frequency distribution of the prices of clothes in the stores. Make sure to include the following in your R script: 1. The title of the plot as 'Frequency Distribution of Price charged by BestStyle' 2. The axes labelled as 'Frequency' and 'Price of Clothes' Note: For the R-code, please submit the R script separately as mentioned in the instructions Marks 2 marks Your Answer
Step by Step Solution
There are 3 Steps involved in it
Step: 1

Get Instant Access to Expert-Tailored Solutions
See step-by-step solutions with expert insights and AI powered tools for academic success
Step: 2

Step: 3
Ace Your Homework with AI
Get the answers you need in no time with our AI-driven, step-by-step assistance
Get Started
Own Your Money
Authors: Michela Allocca
1st Edition
0760381127, 978-0760381120