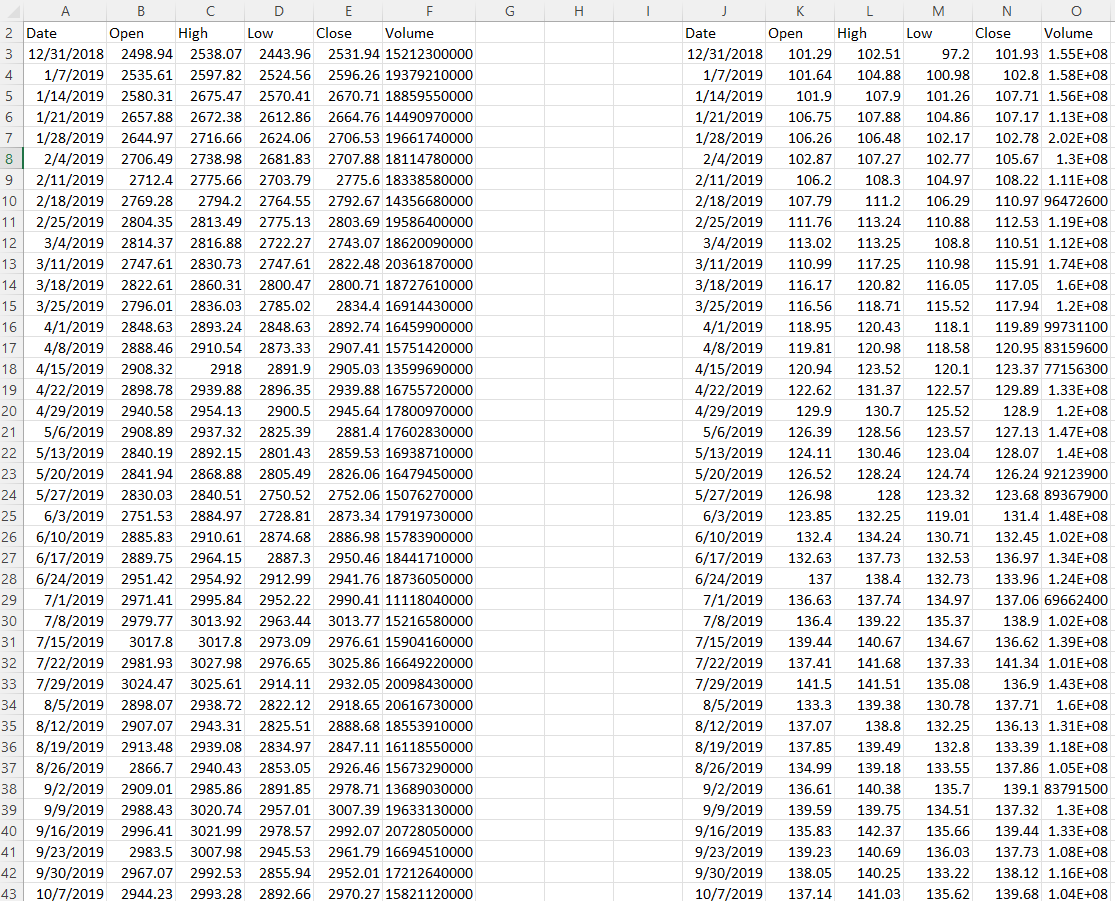
Beta is a key input for the Capital Asset Pricing Model (CAPM). Use the empirical data in the attached excel file to calculate beta for MSFT stock.


G H 1 A B D E F F 2 Date Open High Low Close Volume 3 12/31/2018 2498.94 2538.07 2443.96 2531.94 15212300000 4 1/7/2019 2535.61 2597.82 2524.56 2596.26 19379210000 5 1/14/2019 2580.31 2675.47 2570.41 2670.71 18859550000 6 1/21/2019 2657.88 2672.38 2612.86 2664.76 14490970000 7 1/28/2019 2644.97 2716.66 2624.06 2706.53 19661740000 8 2/4/2019 2706.49 2738.98 2681.83 2707.88 18114780000 9 2/11/2019 2712.4 2775.66 2703.79 2775.6 18338580000 10 2/18/2019 2769.28 2794.2 2764.55 2792.67 14356680000 11 2/25/2019 2804.35 2813.49 2775.13 2803.69 19586400000 12 3/4/2019 2814.37 2816.88 2722.27 2743.07 18620090000 13 3/11/2019 2747.61 2830.73 2747.61 2822.48 20361870000 14 3/18/2019 2822.61 2860.31 2800.47 2800.71 18727610000 15 3/25/2019 2796.01 2836.03 2785.02 2834.4 16914430000 16 4/1/2019 2848.63 2893.24 2848.63 2892.74 16459900000 17 4/8/2019 2888.46 2910.54 2873.33 2907.41 15751420000 18 4/15/2019 2908.32 2918 2891.9 2905.03 13599690000 19 4/22/2019 2898.78 2939.88 2896.35 2939.88 16755720000 20 4/29/2019 2940.58 2954.13 2900.5 2945.64 17800970000 21 5/6/2019 2908.89 2937.32 2825.39 2881.4 17602830000 22 5/13/2019 2840.19 2892.15 2801.43 2859.53 16938710000 23 5/20/2019 2841.94 2868.88 2805.49 2826.06 16479450000 24 5/27/2019 2830.03 2840.51 2750.52 2752.06 15076270000 25 6/3/2019 2751.53 2884.97 2728.81 2873.34 17919730000 26 6/10/2019 2885.83 2910.61 2874.68 2874.68 2886.98 15783900000 27 6/17/2019 2889.75 2964.15 2887.3 2950.46 18441710000 28 6/24/2019 2951.42 2954.92 2912.99 2941.76 18736050000 29 7/1/2019 2971.41 2995.84 2952.22 2990.41 11118040000 30 7/8/2019 2979.77 3013.92 2963.44 3013.77 15216580000 31 7/15/2019 3017.8 3017.8 2973.09 2976.61 15904160000 32 7/22/2019 2981.93 3027.98 2976.65 3025.86 16649220000 33 7/29/2019 3024.47 3025.61 2914.11 2932.05 20098430000 34 8/5/2019 2898.07 2938.72 2822.12 2918.65 20616730000 35 8/12/2019 2907.07 2943.31 2825.51 2888.68 18553910000 36 8/19/2019 2913.48 2939.08 2834.97 2847.11 16118550000 37 8/26/2019 2866.7 2940.43 2853.05 2926.46 15673290000 38 9/2/2019 2909.01 2985.86 2891.85 2978.71 13689030000 39 9/9/2019 2988.43 3020.74 2957.01 3007.39 19633130000 40 9/16/2019 2996.41 3021.99 2978.57 2992.07 20728050000 41 9/23/2019 2983.5 3007.98 2945.53 2961.79 16694510000 42 9/30/2019 2967.07 2992.53 2855.94 2952.01 17212640000 43 10/7/2019 2944.23 2993.28 2892.66 2970.27 15821120000 K L M N O Date Open High Low Close Volume 12/31/2018 101.29 102.51 97.2 101.93 1.55E+08 1/7/2019 101.64 104.88 100.98 102.8 1.58E+08 1/14/2019 101.9 107.9 101.26 107.71 1.56E+08 1/21/2019 106.75 107.88 104.86 107.17 1.13E+08 1/28/2019 106.26 106.48 102.17 102.78 2.02E+08 2/4/2019 102.87 107.27 102.77 105.67 1.3E+08 + 2/11/2019 106.2 108.3 104.97 108.22 1.11E+08 2/18/2019 107.79 111.2 106.29 110.97 96472600 2/25/2019 111.76 113.24 110.88 112.53 1.19E+08 3/4/2019 113.02 113.25 108.8 110.51 1.12E+08 3/11/2019 110.99 117.25 110.98 115.91 1.74E+08 3/18/2019 116.17 120.82 116.05 117.05 1.6E+08 3/25/2019 116.56 118.71 115.52 117.94 1.2E+08 4/1/2019 118.95 120.43 118.1 119.89 99731100 4/8/2019 119.81 120.98 118.58 120.95 83159600 4/15/2019 120.94 123.52 120.1 123.37 77156300 4/22/2019 122.62 131.37 122.57 129.89 1.33E+08 4/29/2019 129.9 130.7 125.52 128.9 1.2E+08 5/6/2019 126.39 128.56 123.57 127.13 1.47E+08 5/13/2019 124.11 130.46 123.04 128.07 1.4E+08 5/20/2019 126.52 128.24 124.74 126.24 92123900 5/27/2019 126.98 128 123.32 123.68 89367900 6/3/2019 123.85 132.25 119.01 131.4 1.48E+08 6/10/2019 132.4 134.24 130.71 132.45 1.02E+08 6/17/2019 132.63 137.73 132.53 136.97 1.34E+08 6/24/2019 137 138.4 132.73 133.96 1.24E+08 7/1/2019 136.63 137.74 134.97 137.06 69662400 7/8/2019 136.4 139.22 135.37 138.9 1.02E+08 7/15/2019 139.44 140.67 134.67 136.62 1.39E+08 7/22/2019 137.41 141.68 137.33 141.34 1.01E+08 7/29/2019 141.5 141.51 135.08 136.9 1.43E+08 8/5/2019 133.3 139.38 130.78 137.71 1.6E+08 8/12/2019 137.07 138.8 132.25 136.13 1.31E+08 8/19/2019 137.85 139.49 132.8 133.39 1.18E+08 8/26/2019 134.99 139.18 133.55 137.86 1.05E+08 9/2/2019 136.61 140.38 135.7 139.1 83791500 9/9/2019 139.59 139.75 134.51 137.32 1.3E+08 9/16/2019 135.83 142.37 135.66 139.44 1.33E+08 9/23/2019 139.23 140.69 136.03 137.73 1.08E+08 9/30/2019 138.05 140.25 133.22 138.12 1.16E+08 10/7/2019 141.03 135.62 139.68 1.04E+08 137.14 44 10/14/2019 2965.81 3008.29 2962.94 2986.2 15500580000 45 10/21/2019 2996.48 3027.39 2991.21 3022.55 17251350000 46 10/28/2019 3032.12 3066.95 3023.19 3066.91 18956670000 47 11/4/2019 3078.96 3097.77 3065.89 3093.08 20734960000 48 11/11/20193080.33 3120.46 3075.82 3120.46 16622540000 49 11/18/2019 3117.91 3127.64 3091.41 3110.29 18008990000 50 11/25/2019 3117.44 3154.26 3117.44 3140.98 12883230000 51 12/2/2019 3143.85 3150.6 3070.33 3145.91 17452390000 52 12/9/2019 3141.86 3182.68 3126.09 3168.8 17669880000 53 12/16/2019 3183.63 3225.65 3225.65 3183.63 3221.22 22078130000 54 12/23/2019 3226.05 3226.05 3247.93 3220.51 3240.02 8946500000 55 12/30/2019 3240.09 3258.14 3212.03 3234.85 12826640000 10/14/2019 10/21/2019 10/28/2019 11/4/2019 11/11/2019 11/18/2019 11/25/2019 12/2/2019 12/9/2019 12/16/2019 12/23/2019 12/30/2019 139.69 138.45 144.4 144.83 145.34 150.07 150 151.81 151.07 155.11 158.12 158.99 141.79 141.14 145.67 145.99 149.99 151.33 152.5 151.87 154.89 158.49 159.55 160.73 136.56 135.61 142.65 143.2 144.73 148.46 149.92 137.41 1.07E+08 140.73 1.4E+08 143.72 1.32E+08 145.96 86257400 149.97 93138900 149.59 1.06E+08 151.38 74202700 151.75 1.03E+08 154.53 1E+08 157.41 1.52E+08 158.96 59640800 158.62 78456100 146.65 150.33 153.75 157.12 156.45


