Answered step by step
Verified Expert Solution
Question
1 Approved Answer
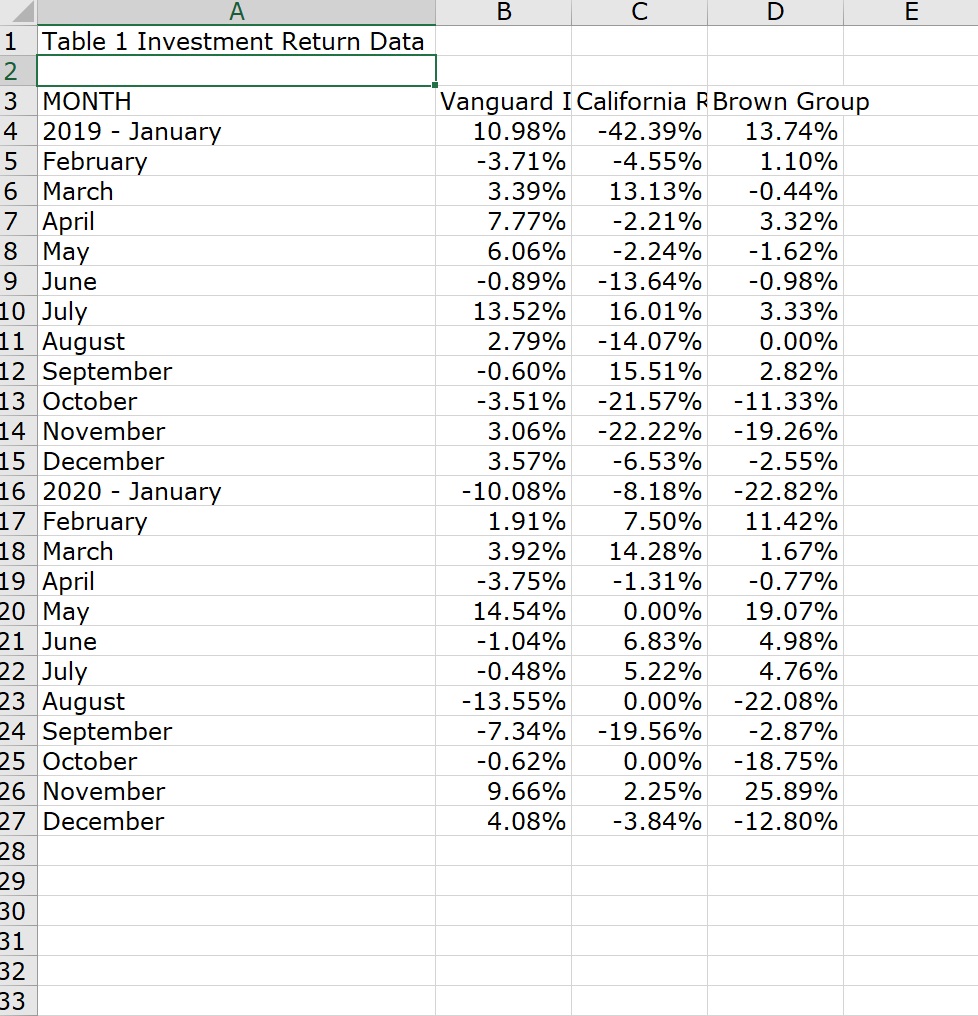
Beta management company Carry out an analysis of the case and answer the following questions. Calculate the variability (standard deviation) of the stock returns of

Beta management company
Carry out an analysis of the case and answer the following questions.
- Calculate the variability (standard deviation) of the stock returns of California REIT and Brown Group during the past two years. How variable are they compared with Vanguard Index 500 Trust? Which stock appears to be riskiest?
- Suppose Betas position had been 95% of equity funds invested in the index fund, and 5% in the individual stock. Calculate the variability of this portfolio using each stock. How does each stock affect the variability of the equity investment, and which stock is riskiest? Explain how this makes sense in view of your answer to Question #1 above?
- How much will Sarah (or any diversified investor) require / expect to earn on each stock (given its riskiness) in order to hold it?
- How might the expected return for each stock relate to its riskiness as suggested by capital asset pricing model?
- Which of these two stocks should Sarah add if she had to include a stock to the index fund?
Investors in the market can get a rate of return of 5 percent for their funds in money market mutual funds. Assume a holding period of one year.
B C D E A 1 Table 1 Investment Return Data 2 3 MONTH 4. 2019 - January 5 February 6 March 7 April 8 May 9 June 10 July 11 August 12 September 13 October 14 November 15 December 16 2020 January 17 February 18 March 19 April 20 May 21 June 22 July 23 August 24 September 25 October 26 November 27 December 28 29 30 31 32 Vanguard I California R Brown Group 10.98% -42.39% 13.74% -3.71% -4.55% 1.10% 3.39% 13.13% -0.44% 7.77% -2.21% 3.32% 6.06% -2.24% -1.62% -0.89% -13.64% -0.98% 13.52% 16.01% 3.33% 2.79% -14.07% 0.00% -0.60% 15.51% 2.82% -3.51% -21.57% -11.33% 3.06% -22.22% -19.26% 3.57% -6.53% -2.55% -10.08% -8.18% -22.82% 1.91% 7.50% 11.42% 3.92% 14.28% 1.67% -3.75% -1.31% -0.77% 14.54% 0.00% 19.07% -1.04% 6.83% 4.98% -0.48% 5.22% 4.76% -13.55% 0.00% -22.08% -7.34% -19.56% -2.87% -0.62% 0.00% -18.75% 9.66% 2.25% 25.89% 4.08% -3.84% -12.80% - 33 B C D E A 1 Table 1 Investment Return Data 2 3 MONTH 4. 2019 - January 5 February 6 March 7 April 8 May 9 June 10 July 11 August 12 September 13 October 14 November 15 December 16 2020 January 17 February 18 March 19 April 20 May 21 June 22 July 23 August 24 September 25 October 26 November 27 December 28 29 30 31 32 Vanguard I California R Brown Group 10.98% -42.39% 13.74% -3.71% -4.55% 1.10% 3.39% 13.13% -0.44% 7.77% -2.21% 3.32% 6.06% -2.24% -1.62% -0.89% -13.64% -0.98% 13.52% 16.01% 3.33% 2.79% -14.07% 0.00% -0.60% 15.51% 2.82% -3.51% -21.57% -11.33% 3.06% -22.22% -19.26% 3.57% -6.53% -2.55% -10.08% -8.18% -22.82% 1.91% 7.50% 11.42% 3.92% 14.28% 1.67% -3.75% -1.31% -0.77% 14.54% 0.00% 19.07% -1.04% 6.83% 4.98% -0.48% 5.22% 4.76% -13.55% 0.00% -22.08% -7.34% -19.56% -2.87% -0.62% 0.00% -18.75% 9.66% 2.25% 25.89% 4.08% -3.84% -12.80% - 33Step by Step Solution
There are 3 Steps involved in it
Step: 1

Get Instant Access to Expert-Tailored Solutions
See step-by-step solutions with expert insights and AI powered tools for academic success
Step: 2

Step: 3

Ace Your Homework with AI
Get the answers you need in no time with our AI-driven, step-by-step assistance
Get Started


