Beverage Johnson, INC.
Net revenues, cost of goods, gross margin are the same please come up with 5 different rates for customer service costs based costing and revise the last page.
Make a recommendation on what JBI should do to fix this issue and which are more profitable.
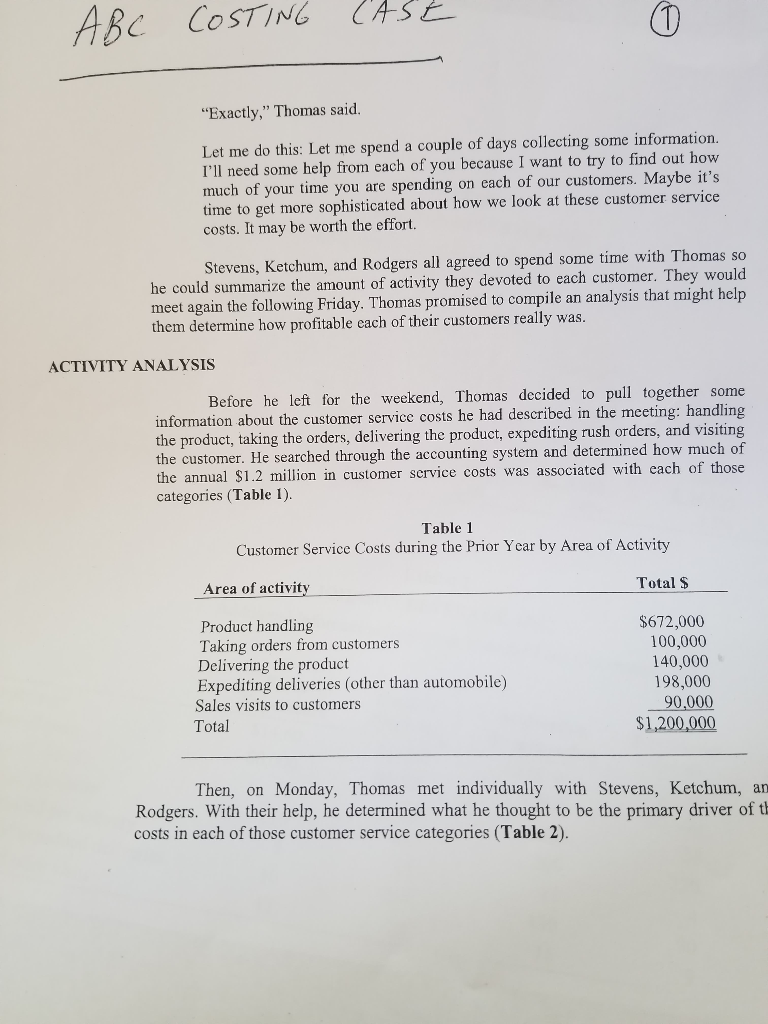
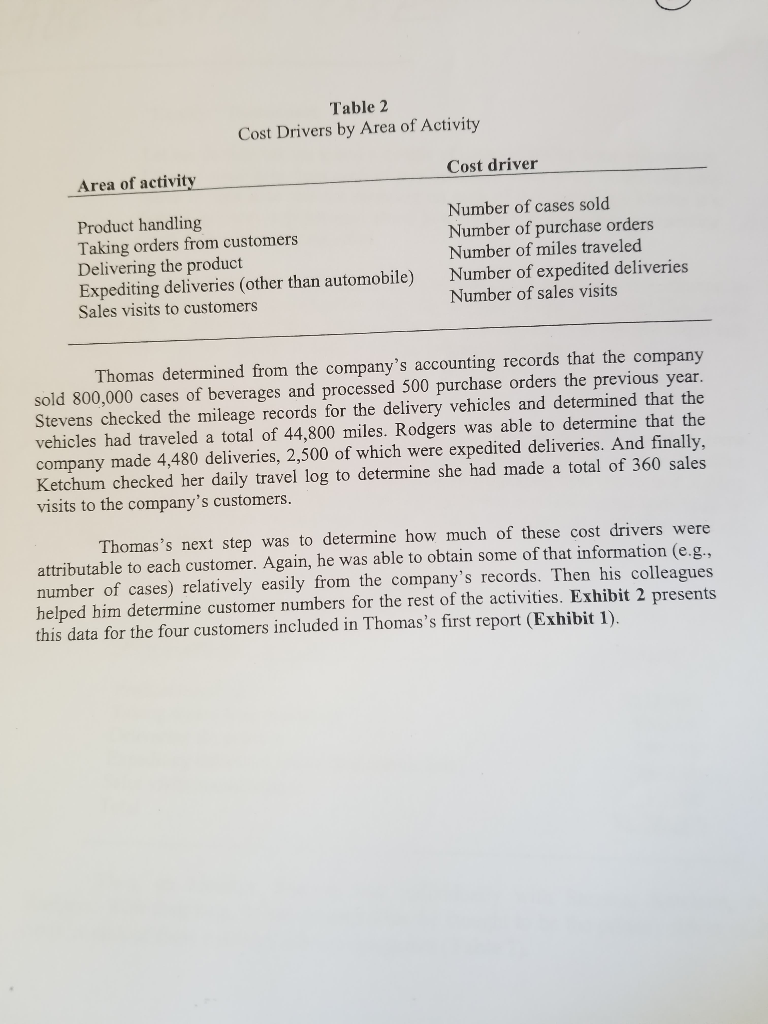
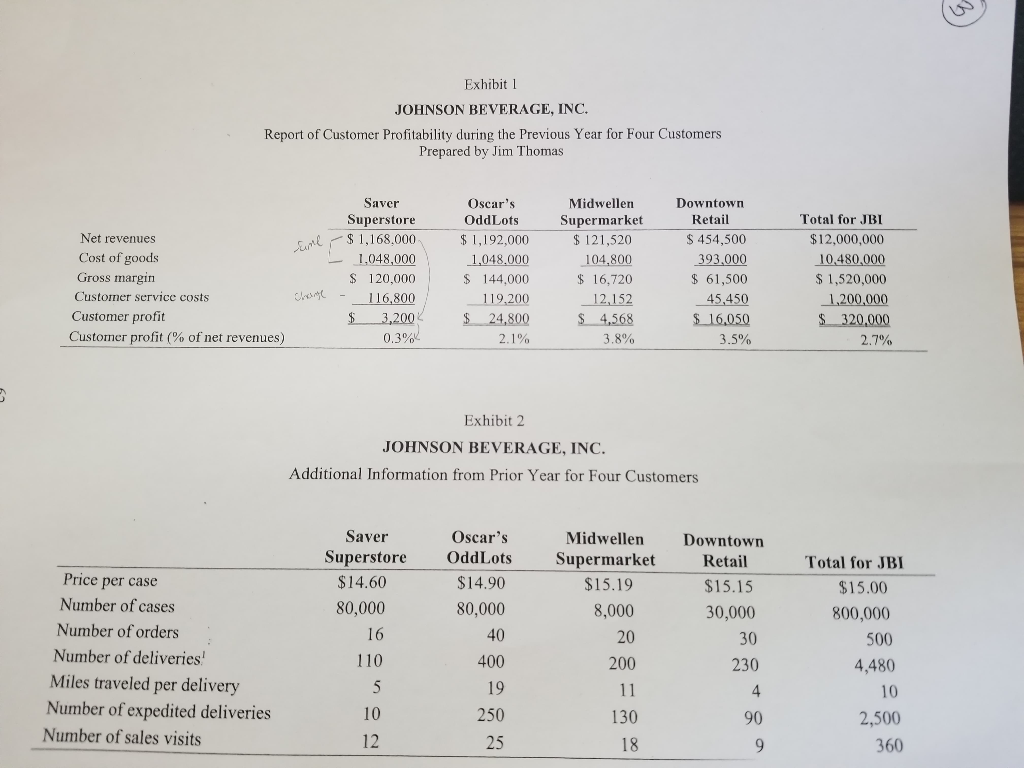
ABC COSTING CASE "Exactly," Thomas said. Let me do this: Let me spend a couple of days collecting some information. I'll need some help from each of you because I want to try to find out how much of your time you are spending on each of our customers. Maybe it's time to get more sophisticated about how we look at these customer service costs. It may be worth the effort. Stevens, Ketchum, and Rodgers all agreed to spend some time with Thomas so he could summarize the amount of activity they devoted to each customer. They would meet again the following Friday. Thomas promised to compile an analysis that might help them determine how profitable each of their customers really was. ACTIVITY ANALYSIS Before he left for the weekend, Thomas decided to pull together some information about the customer service costs he had described in the meeting: handling the product, taking the orders, delivering the product, expediting rush orders, and visiting the customer. He searched through the accounting system and determined how much of the annual $1.2 million in customer service costs was associated with each of those categories (Table 1). Table 1 Customer Service Costs during the Prior Year by Area of Activity Area of activity Total $ Product handling Taking orders from customers Delivering the product Expediting deliveries (other than automobile) Sales visits to customers Total $672,000 100,000 140,000 198,000 90.000 $1,200,000 Then, on Monday, Thomas met individually with Stevens, Ketchum, an Rodgers. With their help, he determined what he thought to be the primary driver of th costs in each of those customer service categories (Table 2). Table 2 Cost Drivers by Area of Activity Area of activity Cost driver Product handling Taking orders from customers Delivering the product Expediting deliveries (other than automobile) Sales visits to customers Number of cases sold Number of purchase orders Number of miles traveled Number of expedited deliveries Number of sales visits Thomas determined from the company's accounting records that the company sold 800,000 cases of beverages and processed 500 purchase orders the previous year. Stevens checked the mileage records for the delivery vehicles and determined that the vehicles had traveled a total of 44,800 miles. Rodgers was able to determine that the company made 4,480 deliveries, 2,500 of which were expedited deliveries. And finally, Ketchum checked her daily travel log to determine she had made a total of 360 sales visits to the company's customers. Thomas's next step was to determine how much of these cost drivers were attributable to each customer. Again, he was able to obtain some of that information (e.g., number of cases) relatively easily from the company's records. Then his colleagues helped him determine customer numbers for the rest of the activities. Exhibit 2 presents this data for the four customers included in Thomas's first report (Exhibit 1). Exhibit 1 JOHNSON BEVERAGE, INC. Report of Customer Profitability during the Previous Year for Four Customers Prepared by Jim Thomas Net revenues S Cost of goods Gross margin Customer service costs Com Customer profit Customer profit % of net revenues) Saver Superstore $ 1,168,000 1,048,000 $ 120,000 - 116,800 $ 3,200 0.3% Oscar's OddLots $ 1,192,000 1,048.000 $ 144,000 119.200 $ 24,800 2.1% Midwellen Supermarket $ 121,520 104,800 $ 16,720 12,152 $ 4,568 3.8% Downtown Retail $ 454,500 393.000 $ 61,500 45,450 $ 16,050 3.5% Total for JBI $12,000,000 10,480,000 $ 1,520,000 1,200,000 $ 320,000 2.7% Exhibit 2 JOHNSON BEVERAGE, INC. Additional Information from Prior Year for Four Customers Saver Superstore $14.60 80,000 Oscar's OddLots $14.90 80,000 Midwellen Supermarket $15.19 8,000 20 200 Downtown Retail $15.15 30,000 30 Total for JBI $15.00 800,000 500 4,480 Price per case Number of cases Number of orders Number of deliveries! Miles traveled per delivery Number of expedited deliveries Number of sales visits 16 40 110 230 400 19 250 11 10 12 25 130 18 90 9 2,500 360