

Answered step by step
Verified Expert Solution
Question
1 Approved Answer
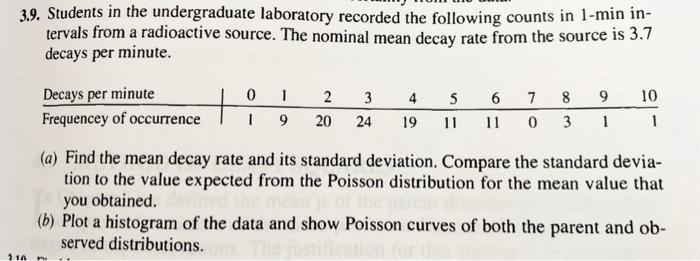
Bevington 3.9. Write Python code to do calculations and W Plot 3.9. Students in the undergraduate laboratory recorded the following counts in 1-min in- tervals
Step by Step Solution
There are 3 Steps involved in it
Step: 1

Get Instant Access to Expert-Tailored Solutions
See step-by-step solutions with expert insights and AI powered tools for academic success
Step: 2

Step: 3
Ace Your Homework with AI
Get the answers you need in no time with our AI-driven, step-by-step assistance
Get Started
Spatio Temporal Database Management International Workshop Stdbm 99 Edinburgh Scotland September 10 11 1999 Proceedings Lncs 1678
Authors: Michael H. Bohlen ,Christian S. Jensen ,Michel O. Scholl
1999th Edition
3540664017, 978-3540664017