Answered step by step
Verified Expert Solution
Link Copied!

Question

1 Approved Answer

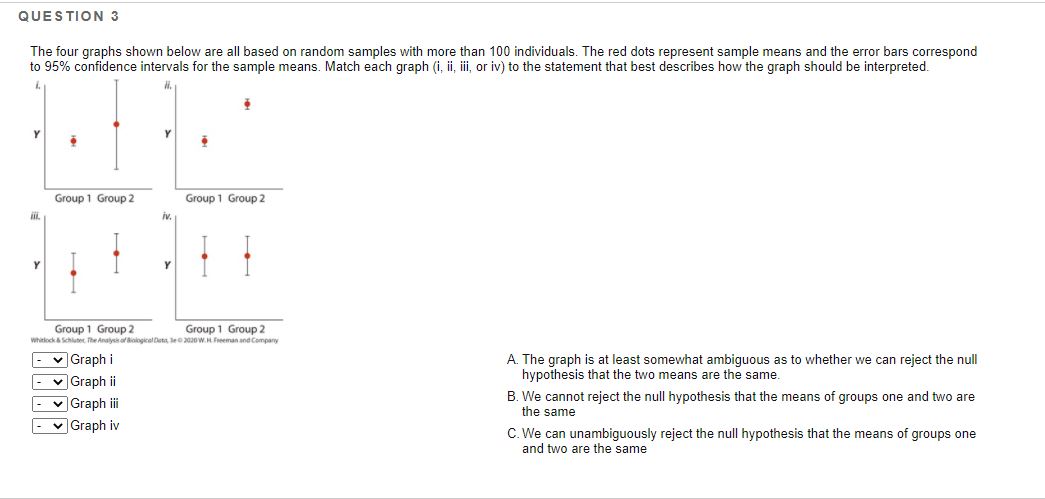
Biostats help QUESTION 3 The four graphs shown b-eiow are all based on random samples with more than 100 individuals. The red dots represent sample

Biostats help

image text in transcribedimage text in transcribed
QUESTION 3 The four graphs shown b-eiow are all based on random samples with more than 100 individuals. The red dots represent sample means and the ermr bats correspond to 95% condence intervals for the sample means. Match each graph (1', i, iii, or hr) to the statement that best describes how the graph should he inte:preted. I. if. 1! r G-uw'iml m. a; 6:01.916\"! Q Grow! Grub! i i Group! Group: Wat-chm hmdmmunmwmum Graph iii Graph iv A The graph is at least somewhat ambiguous as to whether we can reject the null hypothesis fhattihe two means are the same. B. We cannot reject the nuEi hypothesis that the means of groups one and two are the same (3. We can unambiguously reject the null hypothesis that the means of groups one and two are the same QUESTION 1 For each of the following scenarios, the researchers are interested in comparing the mean of a numerical variable measured in two circumstances. Match each scenario to the appropriate ttest. -The body mass of '14 patients before and alter openheart surgery A. Paired ttest -The smoking rates of '14 men measured before and after a stroke B. Twosample ttest -The number of cigarettes smoked per day by 14 men who have had strokes compared with the number smoked by 14 men who have not had strokes -The lead concentration upstream from five power plants compared with the levels downstream from the same power plants -The basal metabolic rate (BMR) of seven chimpanzees compared to the BMR of seven gorillas -The photosynthetic rate of leaves in the crown of ii] Silica spruce trees compared with the photosynthetic rate of leaves near the bottom of the same trees -The photosynthetic rates of 10 randomly chosen Douglasr trees compared with 1i] randomly chosen western red cedar trees -The photosynthetic rate measured on it] randomly chosen Sitka spmce trees compared with the rate measured on the western red cedar growing next to each of the Sitka spruce trees

Step by Step Solution

There are 3 Steps involved in it

Step: 1

blur-text-image

Get Instant Access to Expert-Tailored Solutions

See step-by-step solutions with expert insights and AI powered tools for academic success

Step: 2

blur-text-image

Step: 3

blur-text-image

Ace Your Homework with AI

Get the answers you need in no time with our AI-driven, step-by-step assistance

Get Started

Recommended Textbook for

Intermediate Algebra

Authors: Marvin L Bittinger

11th Edition

ISBN: 0321968395, 9780321968395

More Books

Students also viewed these Mathematics questions

Question

What is grapevine?

Answered: 1 week ago