

Question
Bivariate data for the quantitative variables x and y are given in the table below. These data are plotted in the scatter plot shown next
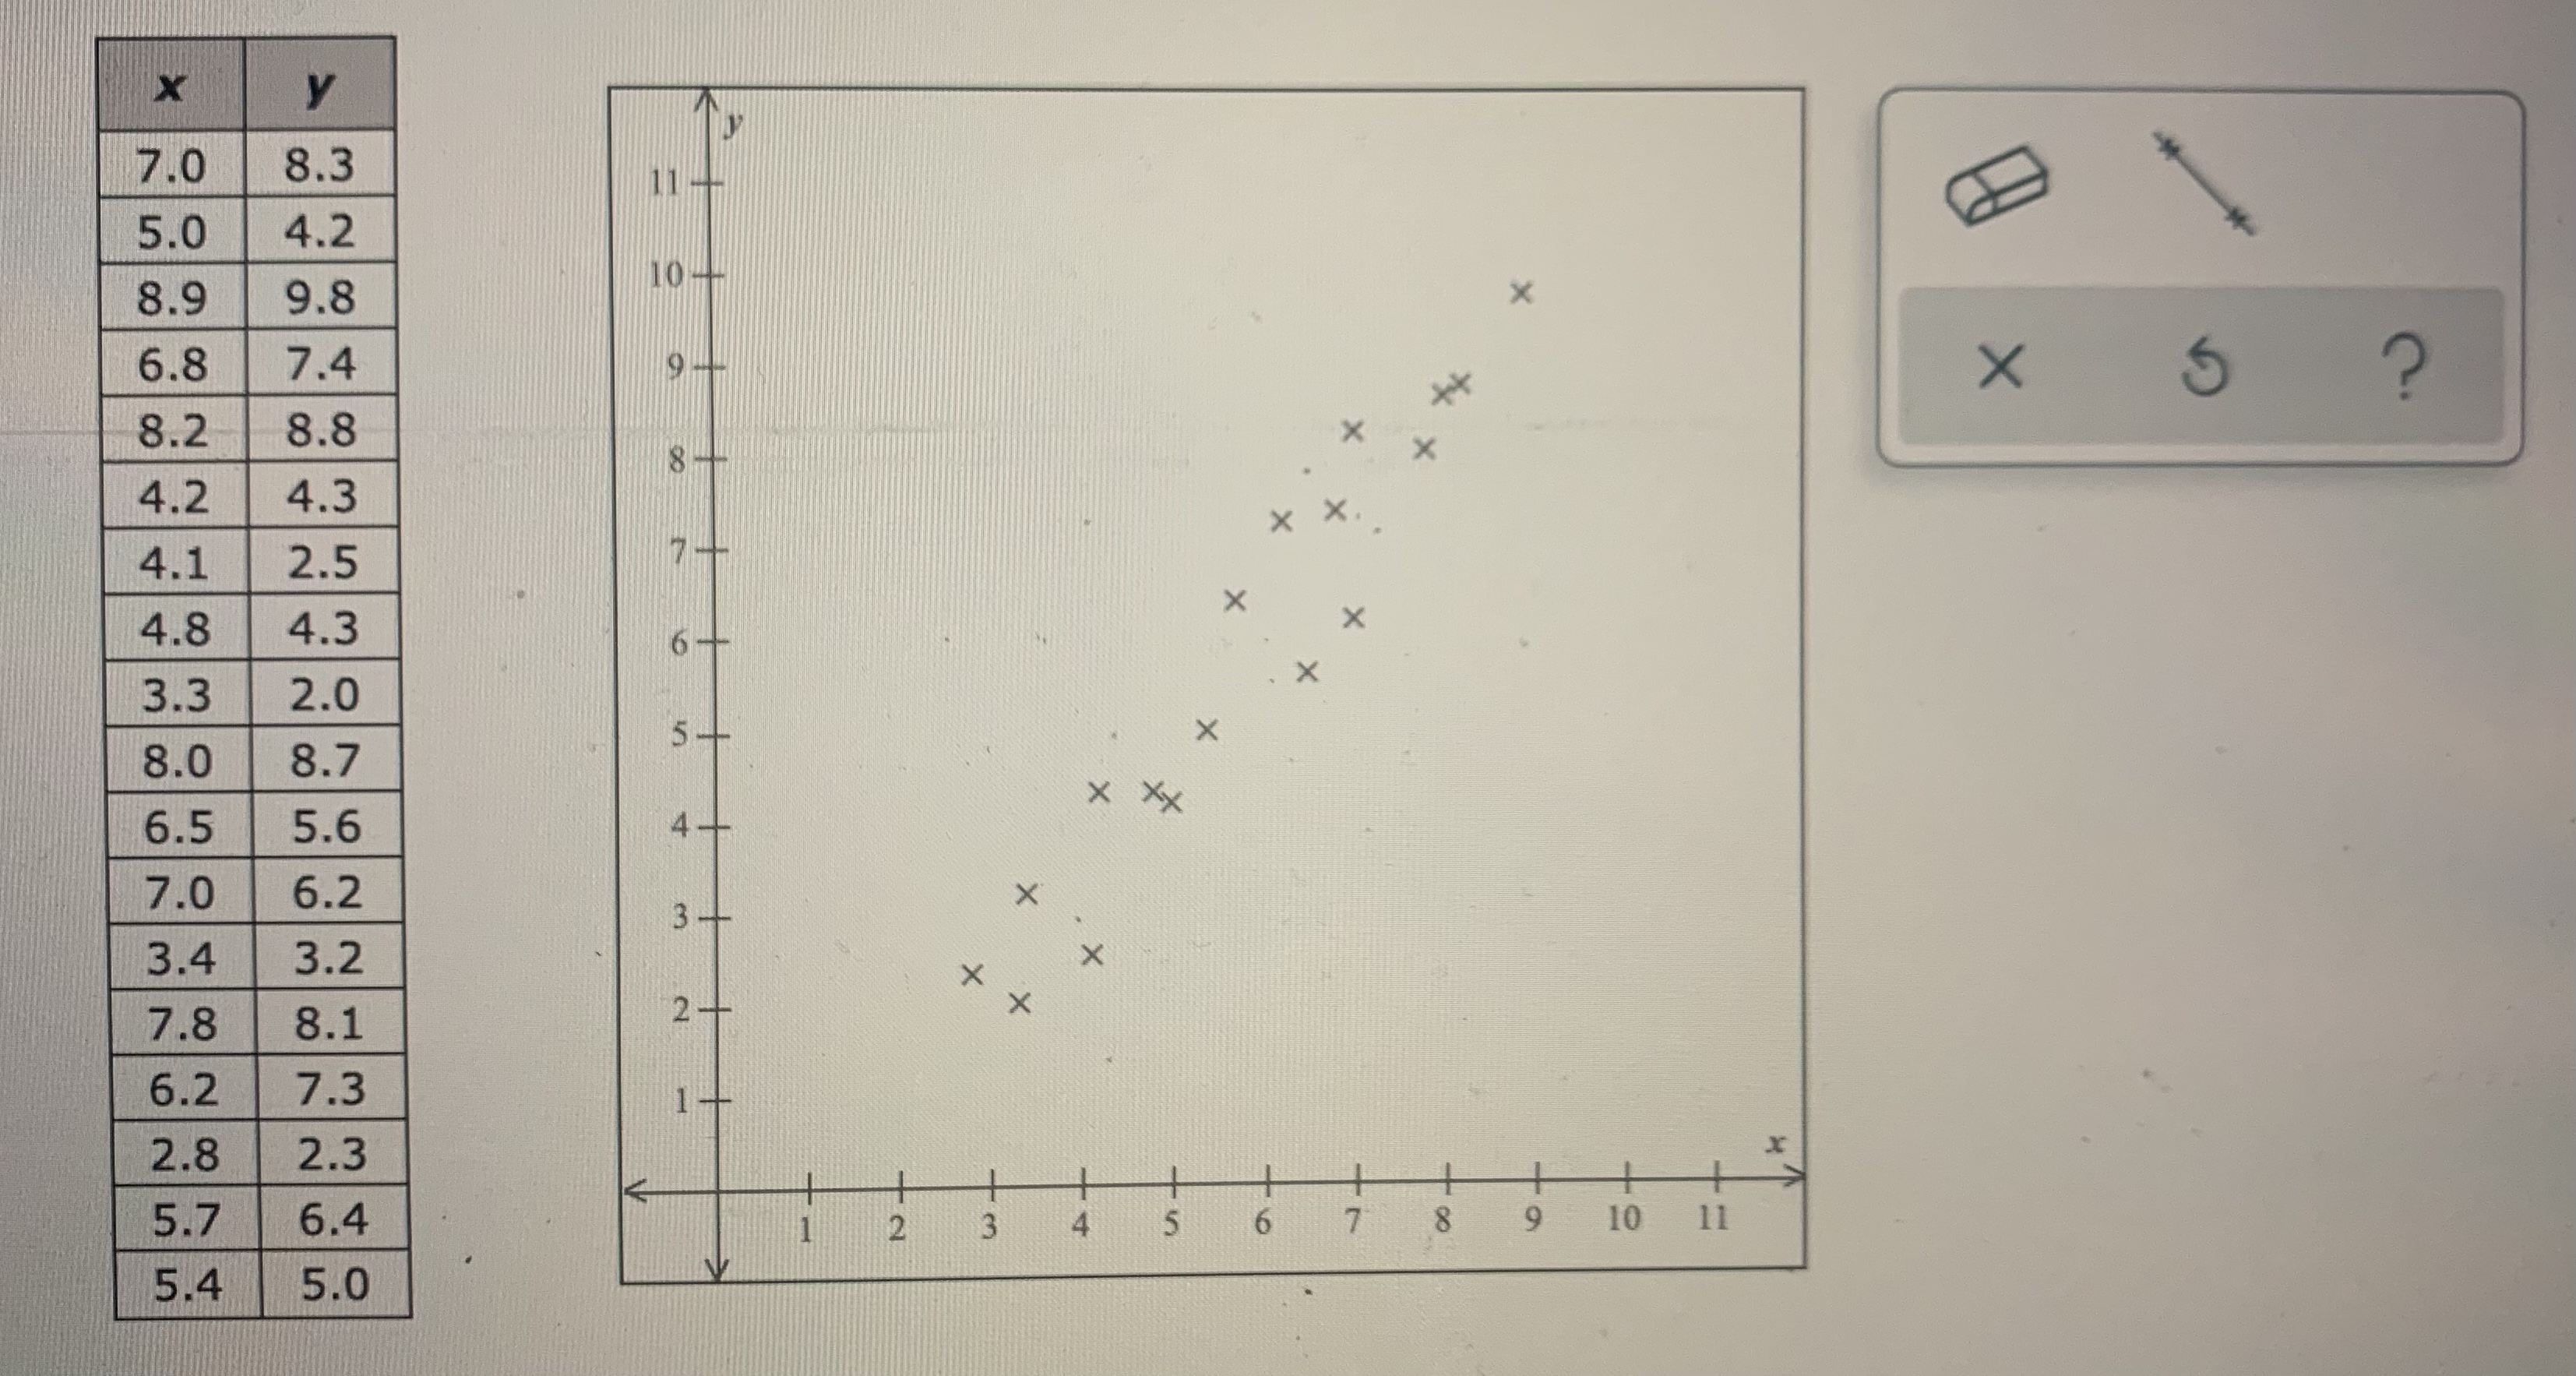
Bivariate data for the quantitative variables x and y are given in the table below. These data are plotted in the scatter plot shown next to the table.
In the scatter plot, sketch an approximation of the least-squares regression line for the data.
Step by Step Solution
There are 3 Steps involved in it
Step: 1

Get Instant Access to Expert-Tailored Solutions
See step-by-step solutions with expert insights and AI powered tools for academic success
Step: 2

Step: 3
Ace Your Homework with AI
Get the answers you need in no time with our AI-driven, step-by-step assistance
Get Started
Intermediate Algebra A Text/Workbook
Authors: Charles P McKeague
2nd Edition
1483214176, 9781483214177