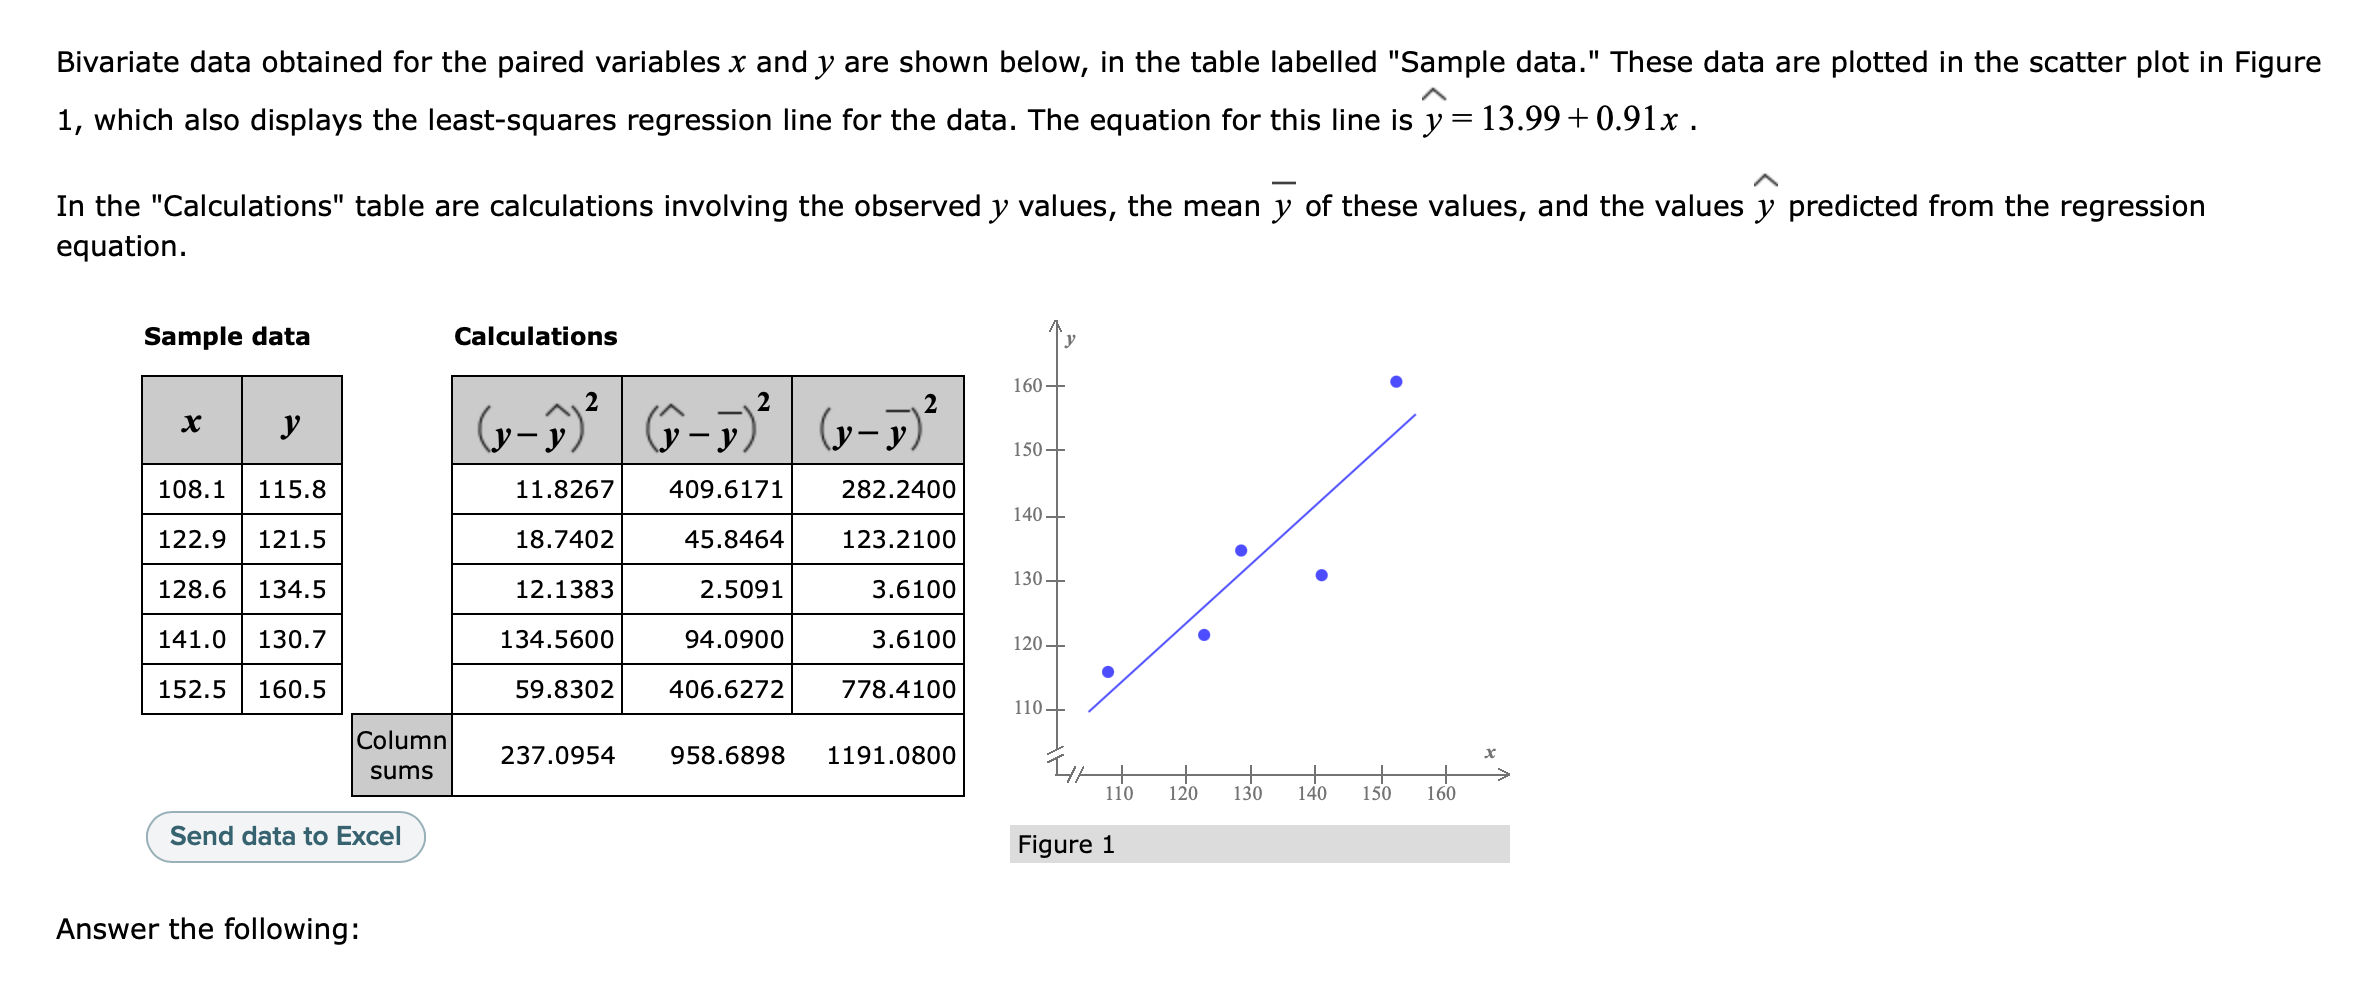
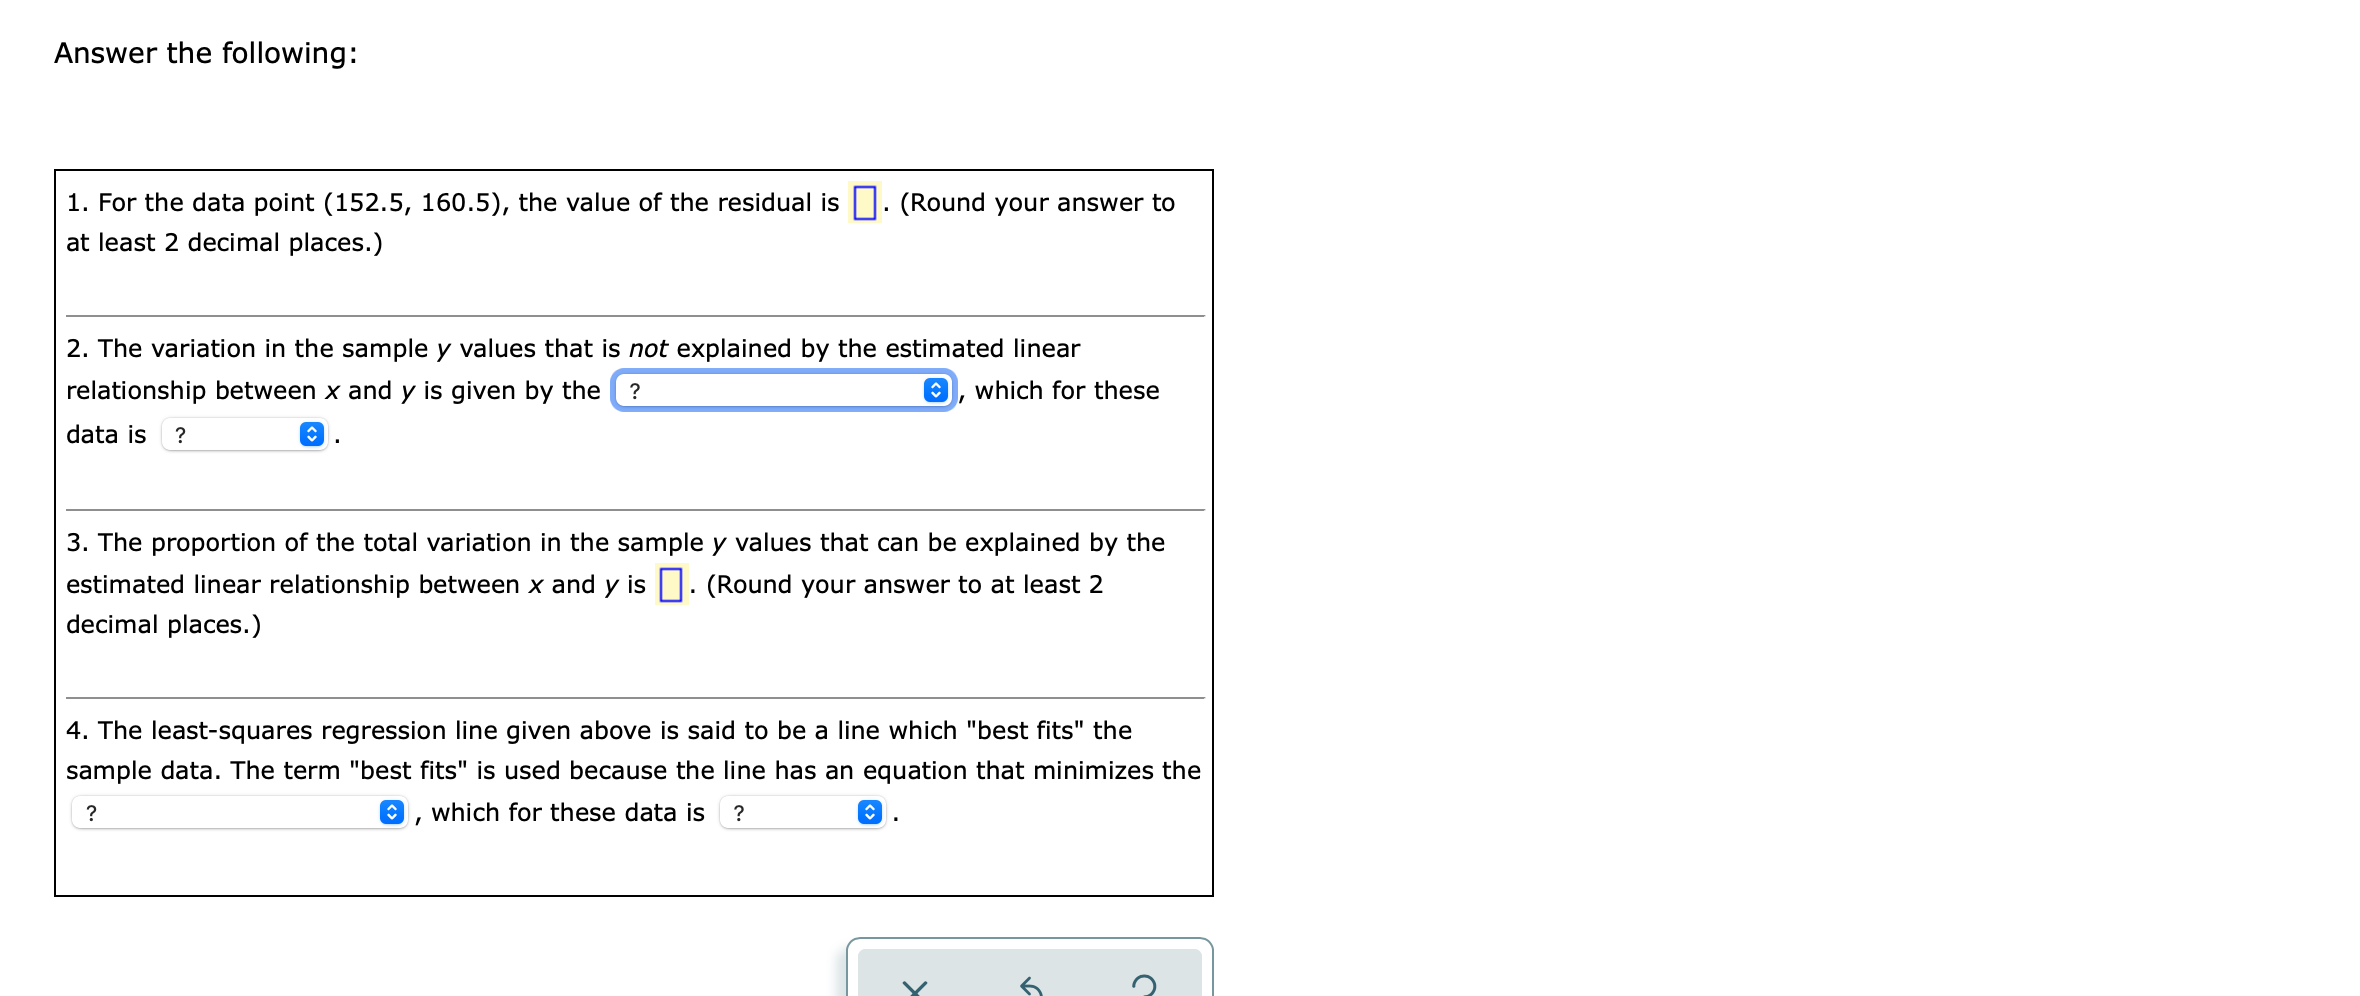
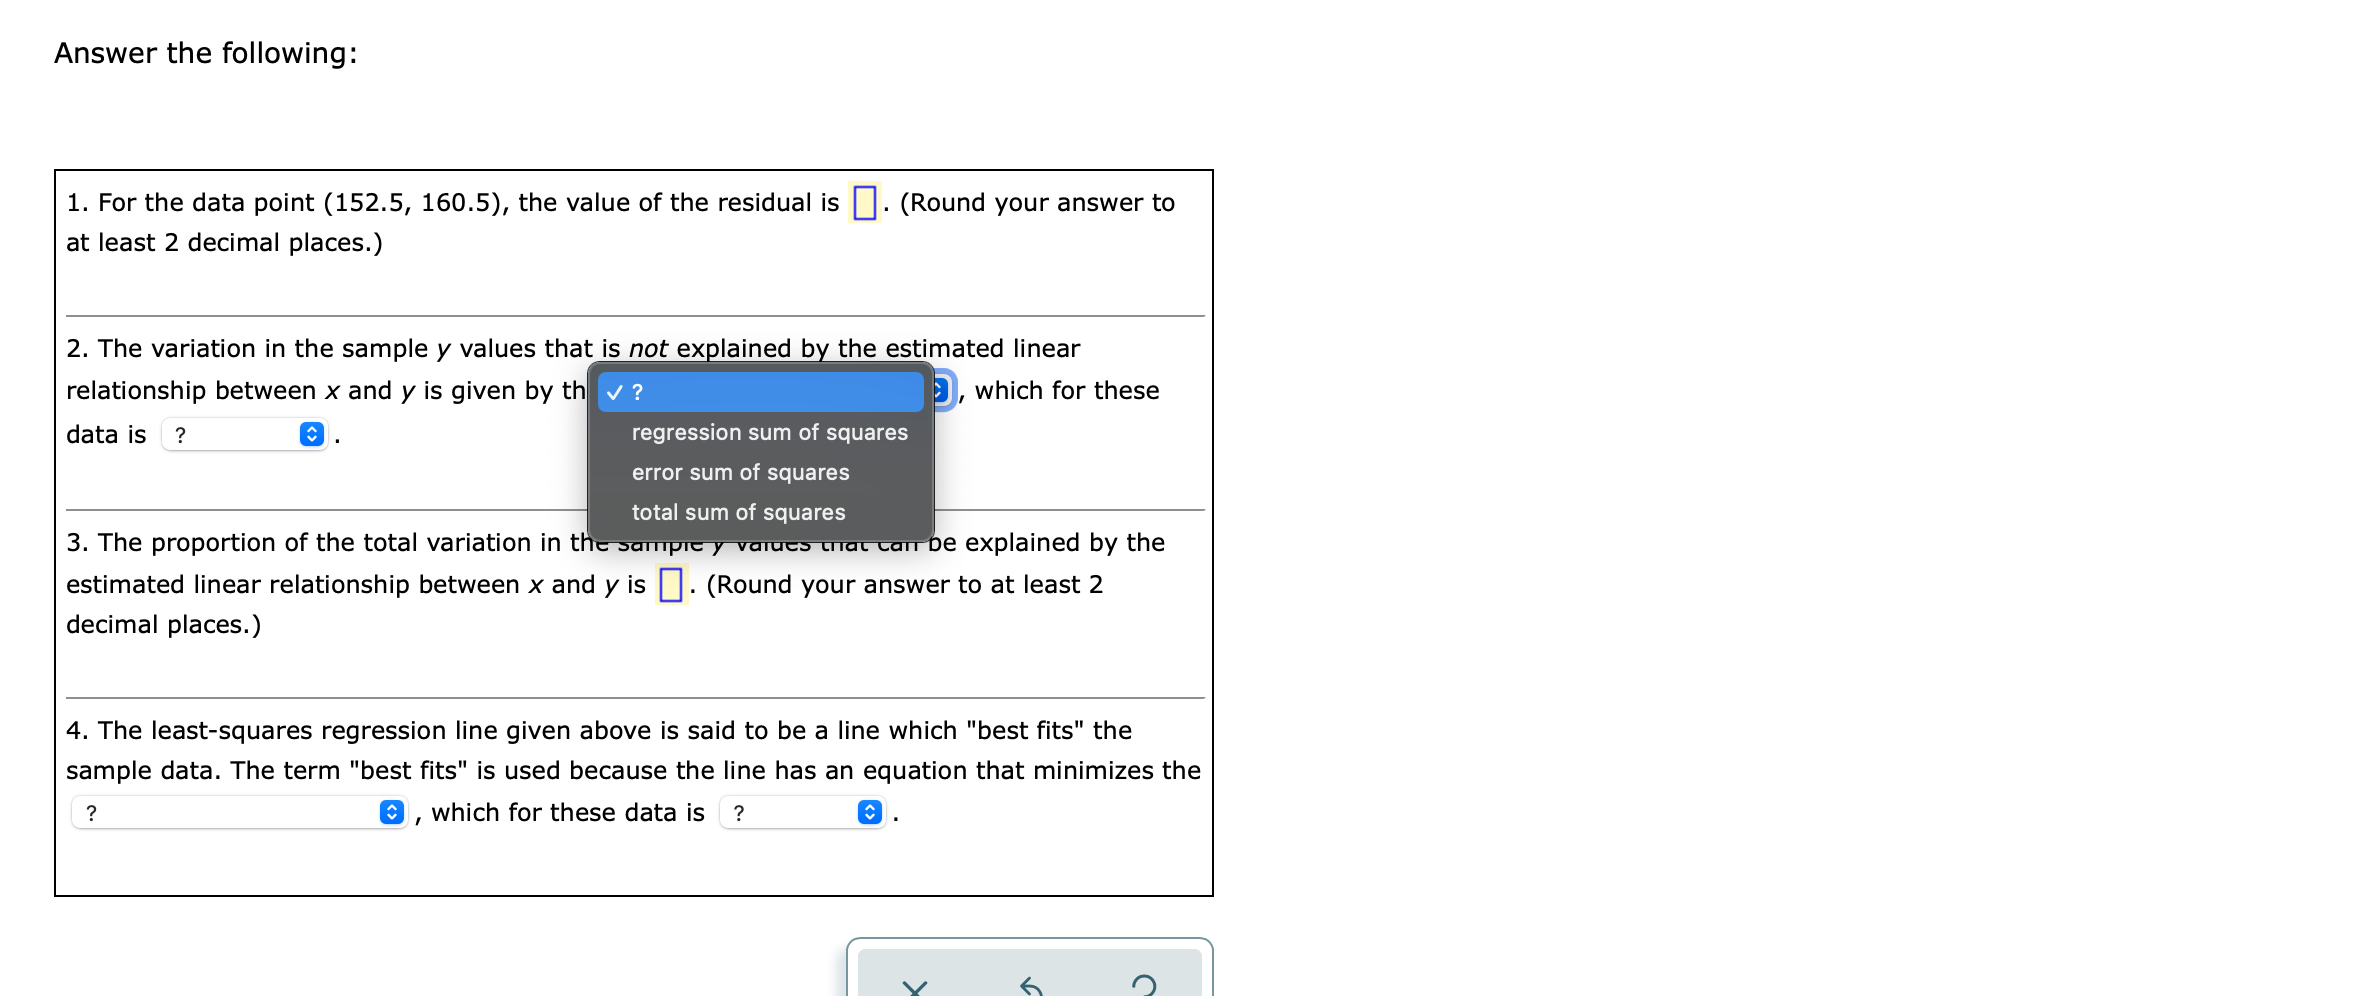
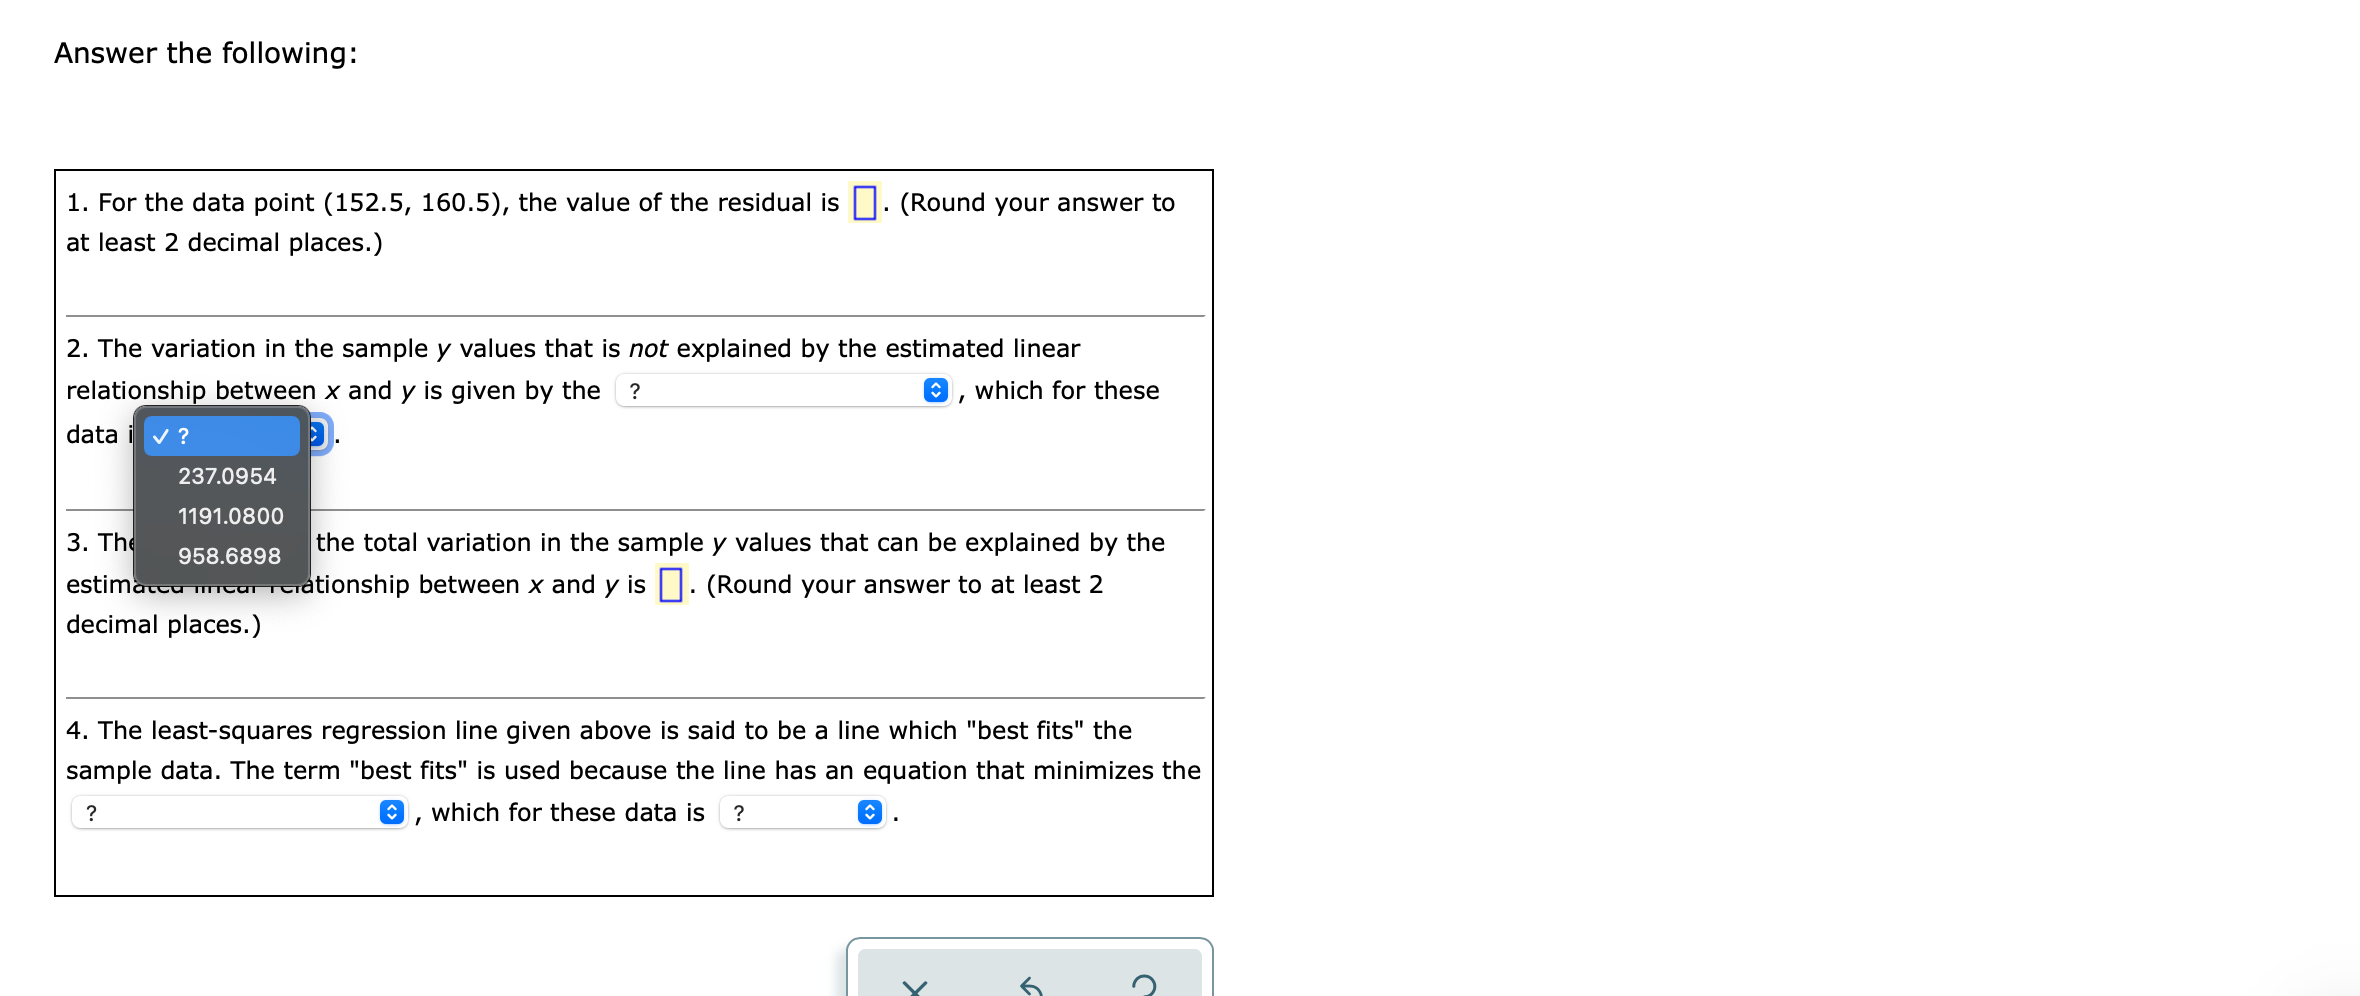
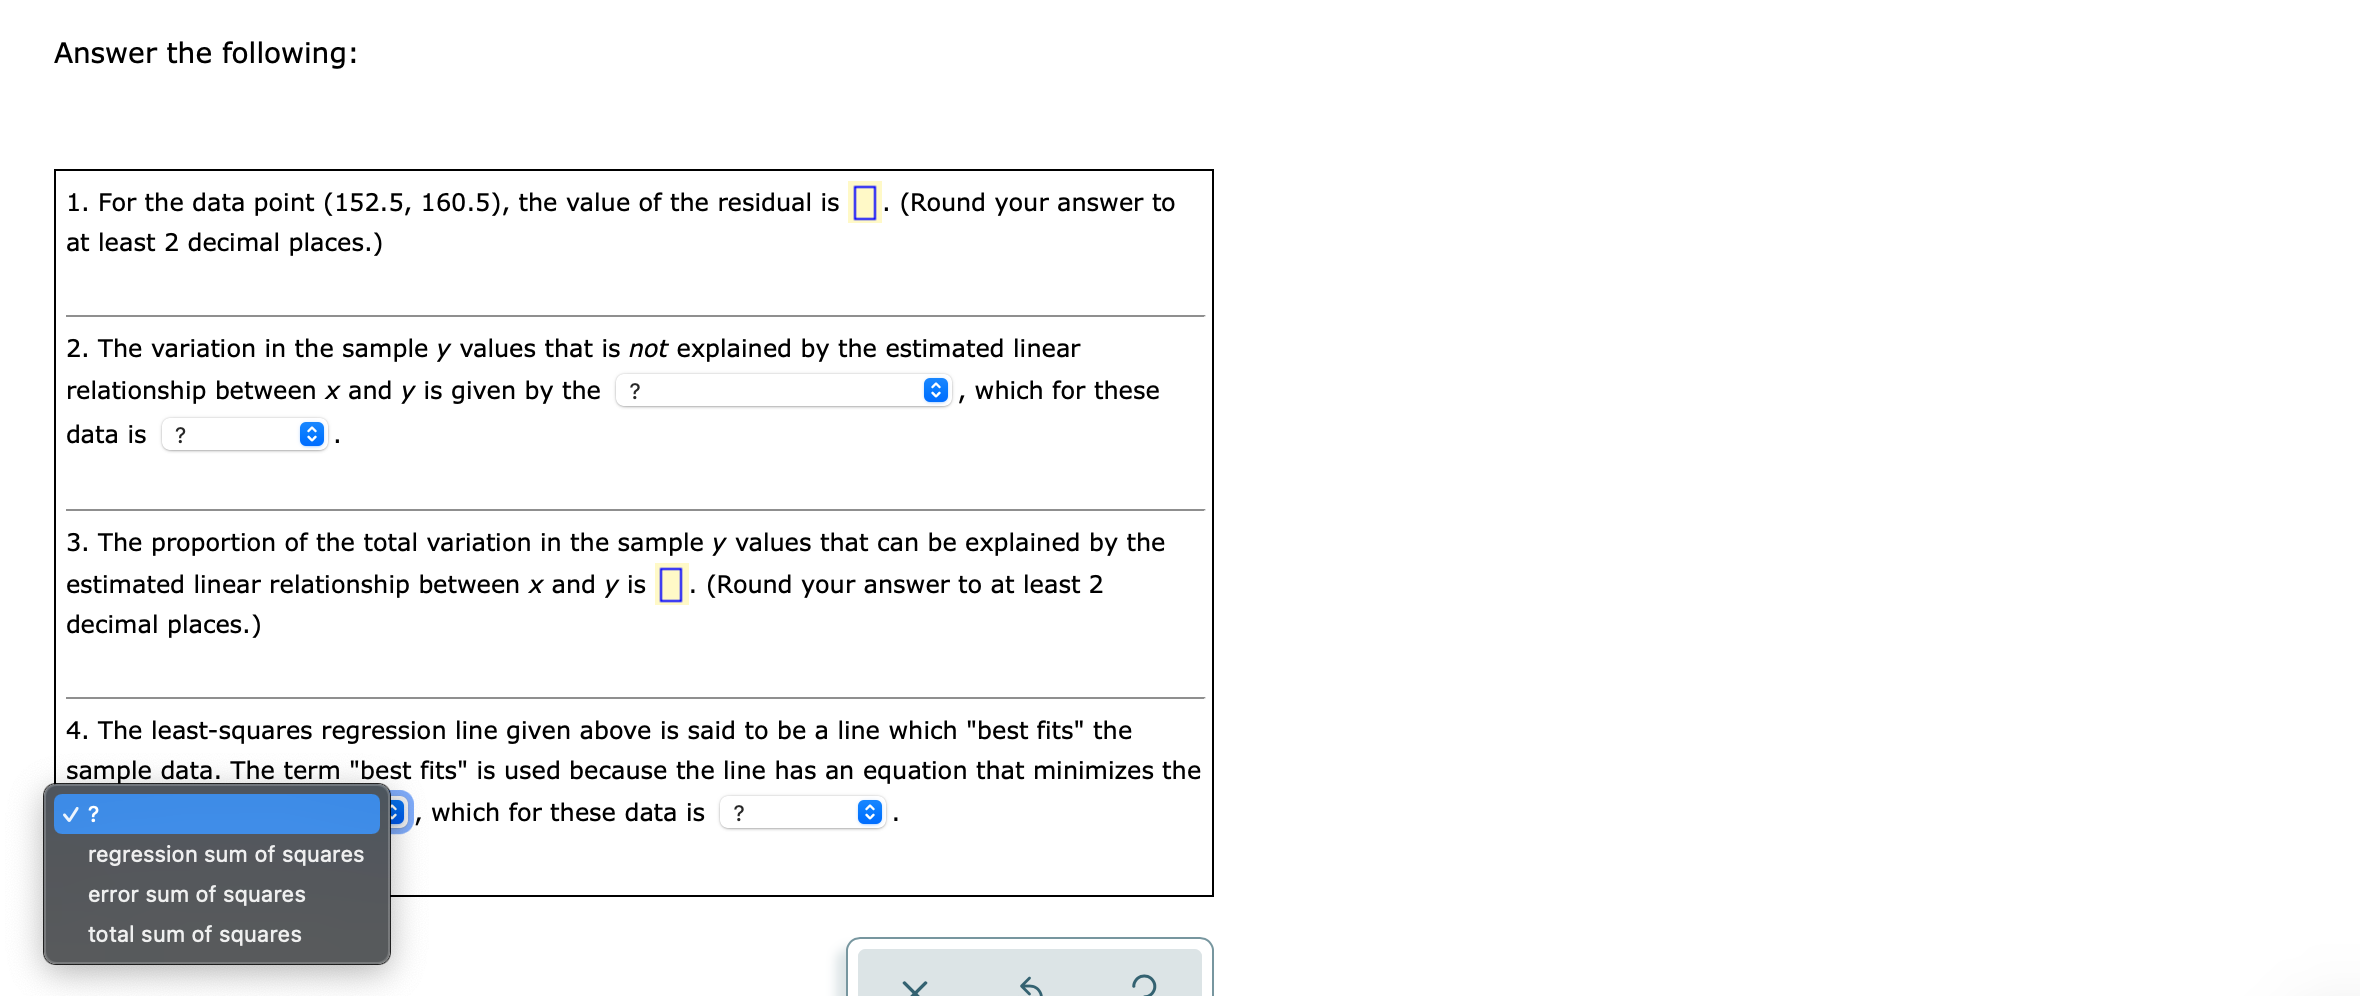
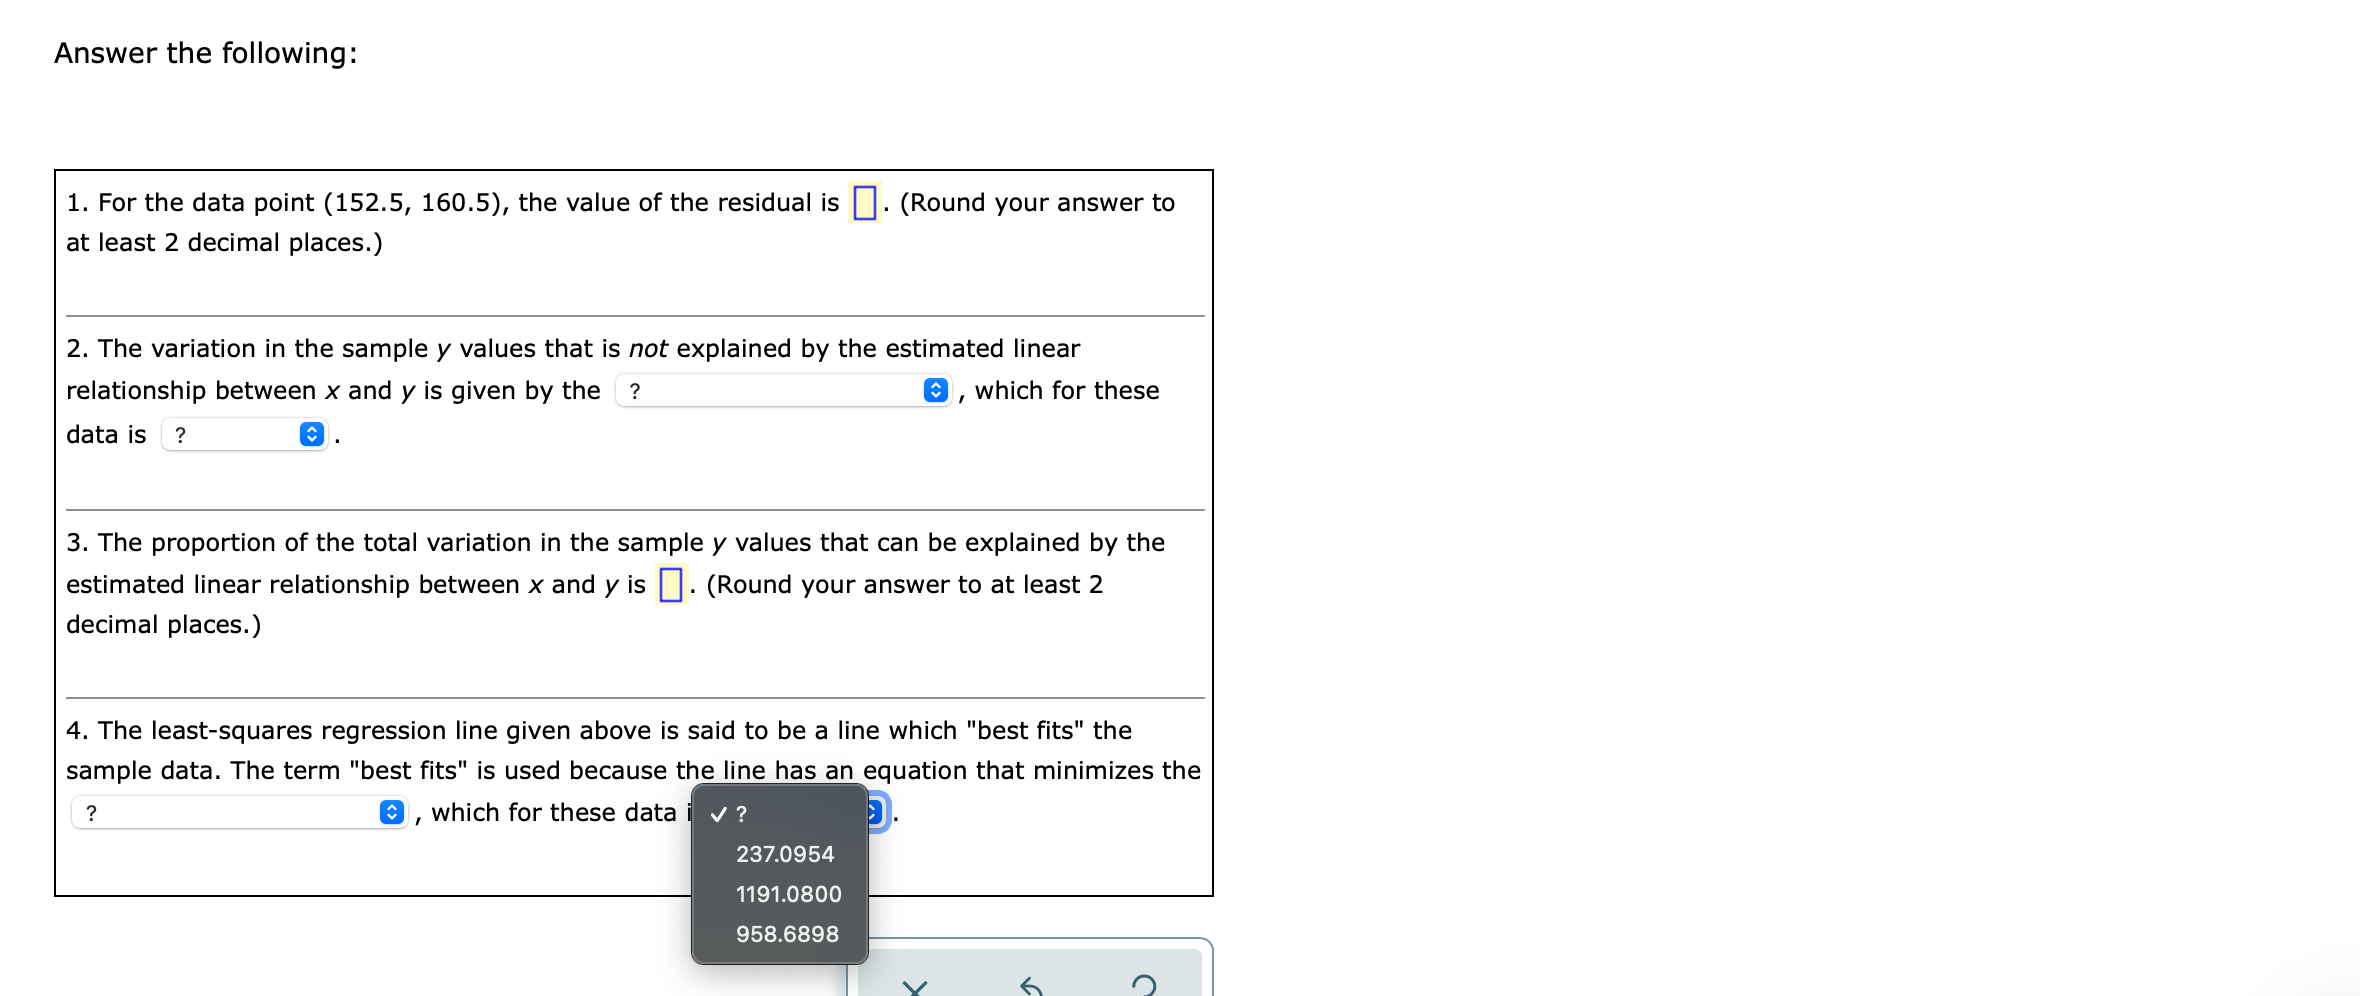
Bivariate data obtained for the paired variables x and y are shown below, in the table labelled "Sample data." These data are plotted in the scatter plot in Figure A 1, which also displays the least-squares regression line for the data. The equation for this line is y = 13.99 + 0.91): . ._. A In the \"Calculations" table are calculations involving the observed y values, the mean y of these values, and the values y predicted from the regression equation. Sample data Calculations y 160 . 150 108.1 115.8 11.8267 409.6171 282.2400 122.9 121.5] 18.7402 45.8464| 123.2100 140 128.6 134.5] 12.1383 2.5091| 3.6100 13 141.0 130.7| 134.5600 94.0900| 3.6100 120 152.5 160.5| 59.8302 406.6272| 778.4100 110 237.0954 958.6898 1191.0800 110 120 130 140 150 160 Send data to Excel Figure 1 Answer the following: Answer the following: 1. For the data point (152.5, 160.5), the value of the residual is El. (Round your answer to at least 2 decimal places.) 2. The variation in the sample y values that is not explained by the estimated linear relationship between x and y is given by the _, which for these data is ? a . 3. The proportion of the total variation in the sample y values that can be explained by the estimated linear relationship between x and y is I]. (Round your answer to at least 2 decimal places.) 4. The least-squares regression line given above is said to be a line which "best fits" the sample data. The term "best ts" is used because the line has an equation that minimizes the ? , a , which for these data is ? , a . Answer the following: 1. For the data point (152.5, 160.5), the value of the residual is . (Round your answer to at least 2 decimal places.) 2. The variation in the sample y values that is not explained by the estimated linear relationship between x and y is given by thev ? , which for these data is ? regression sum of squares error sum of squares total sum of squares 3. The proportion of the total variation in the sample y values that can be explained by the estimated linear relationship between x and y is ] . (Round your answer to at least 2 decimal places.) 4. The least-squares regression line given above is said to be a line which "best fits" the sample data. The term "best fits" is used because the line has an equation that minimizes the ? @, which for these data is ?Answer the following: 1. For the data point (152.5, 160.5), the value of the residual is [:I. (Round your answer to at least 2 decimal places.) 2. The variation in the sample y values that is not explained by the estimated linear relationshi- between x and y is given by the ? a , which for these data \\/ ? 237.0954 119l0800 958.6898 the total variation in the sample y values that can be explained by the tionship between x and y is I]. (Round your answer to at least 2 decimal places.) 4. The least-squares regression line given above is said to be a line which "best fits" the sample data. The term "best ts" is used because the line has an equation that minimizes the ? a , which for these data is ? a . Answer the following: 1. For the data point (152.5, 160.5), the value of the residual is [:I. (Round your answer to at least 2 decimal places.) 2. The variation in the sample y values that is not explained by the estimated linear relationship between x and y is given by the ? a , which for these data is ? a . 3. The proportion of the total variation in the sample y values that can be explained by the estimated linear relationship between x and y is I]. (Round your answer to at least 2 decimal places.) 4. The least-squares regression line given above is said to be a line which "best fits" the sam-le data. The term "best ts" is used because the line has an equation that minimizes the v ? 3 , which for these data is ? a . regression sum Of squares error sum of squares total sum of squares Answer the following: 1. For the data point (152.5, 160.5), the value of the residual is El. (Round your answer to at least 2 decimal places.) 2. The variation in the sample y values that is not explained by the estimated linear relationship between x and y is given by the ? a , which for these data is ? a . 3. The proportion of the total variation in the sample y values that can be explained by the estimated linear relationship between x and y is I]. (Round your answer to at least 2 decimal places.) 4. The least-squares regression line given above is said to be a line which "best fits" the sample data. The term "best ts" is used because the line has an equation that minimizes the ? a , which for these data \\I ? 237.0954 11910800 9586898