

Answered step by step
Verified Expert Solution
Question
1 Approved Answer
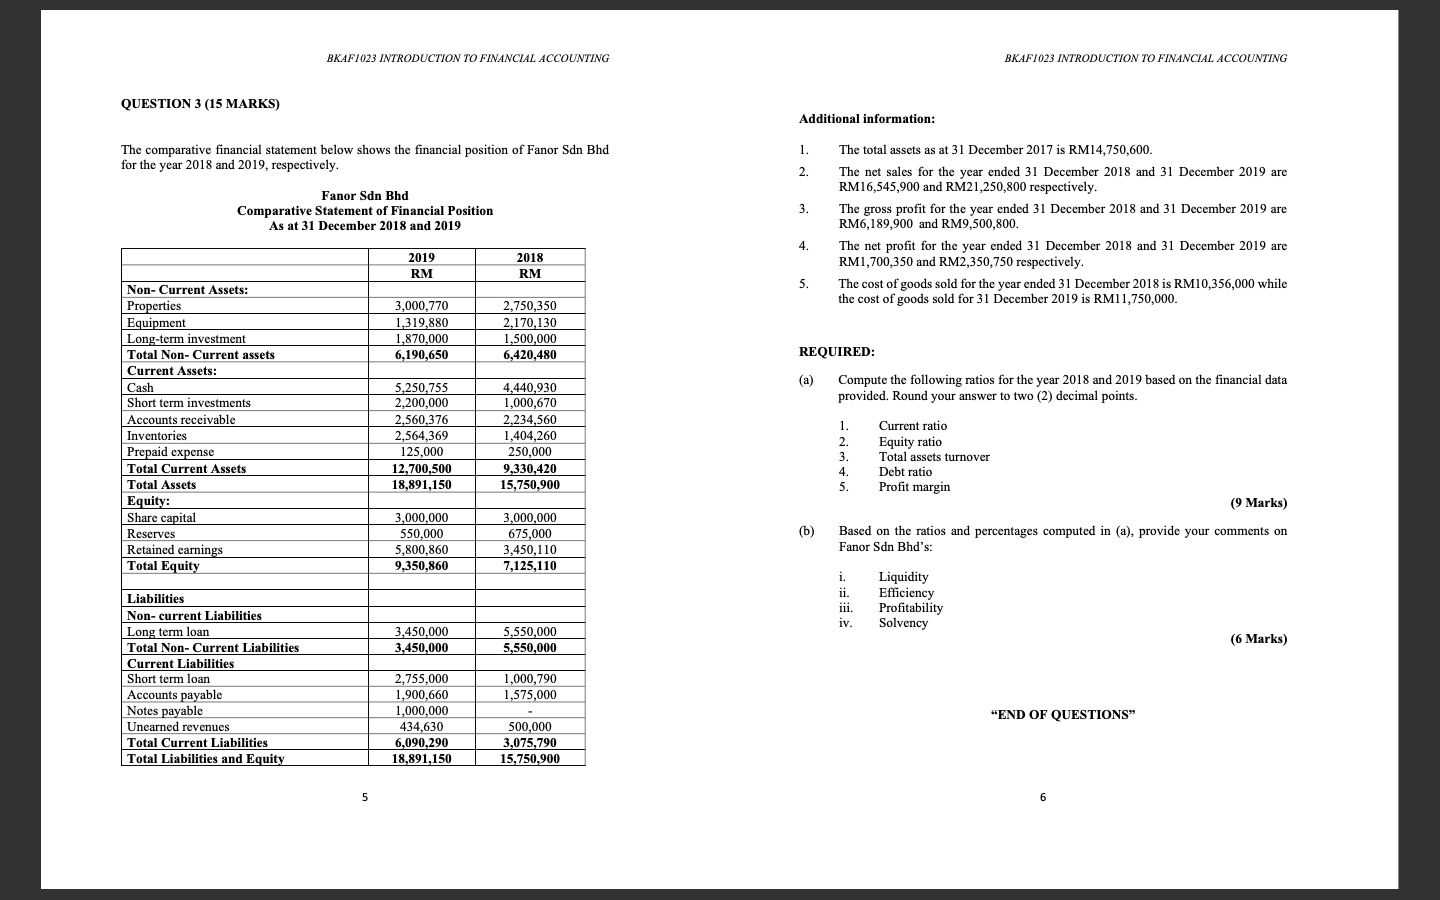
BKAF1023 INTRODUCTION TO FINANCIAL ACCOUNTING BKAF1023 INTRODUCTION TO FINANCIAL ACCOUNTING QUESTION 3 (15 MARKS) Additional information: 1. 2. The comparative financial statement below shows the
Step by Step Solution
There are 3 Steps involved in it
Step: 1

Get Instant Access to Expert-Tailored Solutions
See step-by-step solutions with expert insights and AI powered tools for academic success
Step: 2

Step: 3
Ace Your Homework with AI
Get the answers you need in no time with our AI-driven, step-by-step assistance
Get Started
Acct 1100 Financial Accounting 1 25 Edition
Authors: Carl S. Warren ,James M. Reeve ,Jonathan E. Duchac
1st Edition
1285558839, 978-1285558837