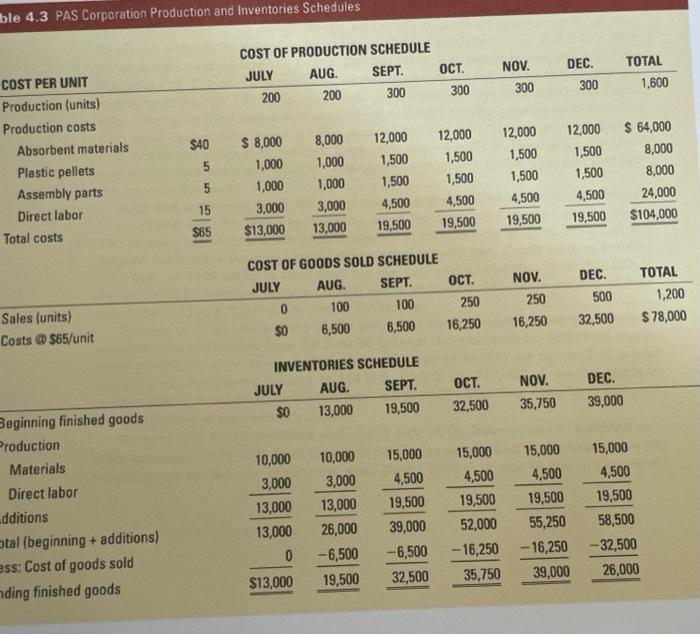
ble 4.3 PAS Corporation Production and Inventories Schedules COST OF PRODUCTION SCHEDULE JULY AUG. SEPT. 200 200 300 OCT. 300 NOV. 300 DEC. 300 TOTAL 1,600 $40 COST PER UNIT Production (units) Production costs Absorbent materials Plastic pellets Assembly parts Direct labor Total costs 5 $ 8,000 1,000 1,000 3,000 $13,000 8,000 1,000 1,000 3,000 13,000 12,000 1,500 1,500 4,500 19,500 12,000 1,500 1,500 4,500 19,500 12,000 1,500 1,500 4,500 19,500 5 12,000 1,500 1,500 4,500 19,500 $ 64,000 8,000 8,000 24,000 $104,000 15 $65 COST OF GOODS SOLD SCHEDULE JULY AUG SEPT. OCT. 0 100 100 250 $0 6,500 6,500 16,250 NOV. 250 16,250 DEC. 500 32,500 TOTAL 1,200 $ 78,000 Sales (units) Costs @ $65/unit INVENTORIES SCHEDULE JULY AUG. SEPT. SO 13,000 19,500 OCT. 32,500 NOV. 35,750 DEC. 39,000 Beginning finished goods Production Materials Direct labor dditions tal (beginning + additions) ess: Cost of goods sold nding finished goods 10,000 3,000 13,000 13,000 0 10,000 3,000 13,000 26,000 -6,500 19,500 15,000 4,500 19,500 39,000 -6,500 32,500 15,000 4,500 19,500 52,000 - 16,250 35,750 15,000 4,500 19,500 55,250 -16,250 39,000 15,000 4,500 19,500 58,500 -32,500 26,000 $13,000 Table 4.4 PAS Corporation Balance Sheet as of December 31 ASSETS Cash and marketable securities Receivables Inventories $ 1.000 50,000 26,000 LIABILITIES AND EQUITY Payables Accrued wages Bank loan Other current liabilities Total current liabilities Long-term debts Owners' equity $15,000 3,000 0 25,000 43,000 10,000 43,000 Total current assets Gross equipment Less: Accumulated depreciation Net equipment Building Other long-term assets Total assets 77,000 20,000 1,000 19,000 0 0 $96,000 Total liabilities and equity 596,000 Refer to the balance shoot in the table 4 4 If you were to prepare a balance shoot onding the last day of August instead of December what amount of inventory? A 532.500 8. 540.000 C$16.250 SD $19.500 DE $35.750