Answered step by step
Verified Expert Solution
Link Copied!

Question

1 Approved Answer

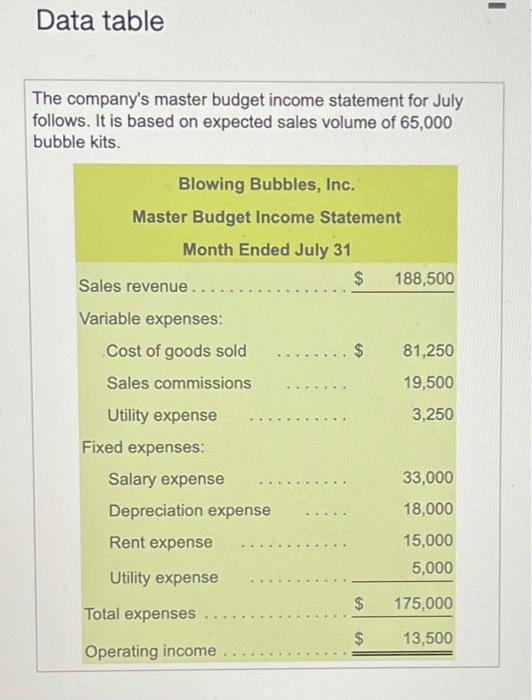
Blowing Bubbles, Inc, produces multicolored bubble solution used for weddings and other events: Requirements 1. Prepare floxible budget income statements for the company, showing output

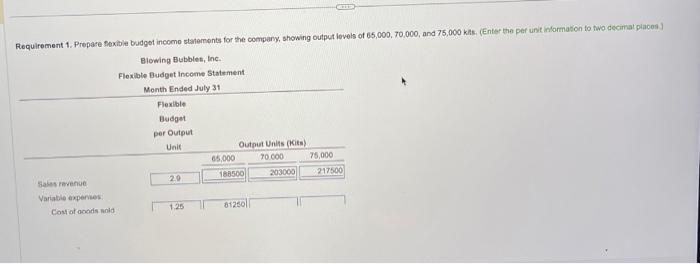
image text in transcribed
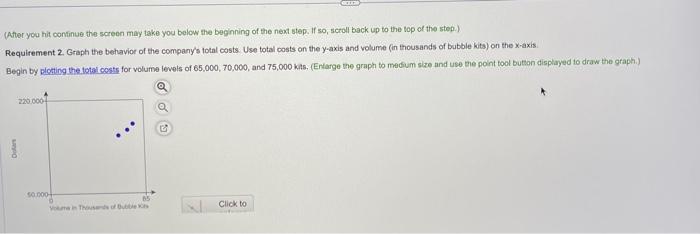
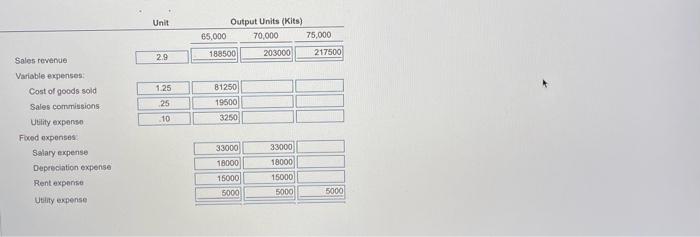
Blowing Bubbles, Inc, produces multicolored bubble solution used for weddings and other events: Requirements 1. Prepare floxible budget income statements for the company, showing output levels of Eff (Click the icon to view the master boidget income statement) 65,000,70,000, and 75,000kits Blowing Bubbles' plant capacily is 72,500 kits. If actual volume excueds 72,500kits, the company 2. Graph the behavior of the company's total conts. Use todal costs on the y.axis and must expand the plant in that case, salaries wal increase by 10%, depreciation by 15%, and rent volurne (in thousands of bubblo kits) on the x-iais by $4,000. Fixed utlites will be unchanged by any volume increase. 3. Why might Biosing Bubbles' managers want to soe the graph you propated in Requirement 2 as weil as the columnar format analysis in Reguerement 17 What is the dsadyantage of the graphic appeonch? Requirement 1. Prepare toxible budget incomo stanernents for the company, showing output lovels of 65,000,70,000, and 75 ,000 khs. (Enter the per unit intormasion to two decimat places. Data table The company's master budget income statement for July follows. It is based on expected sales volume of 65,000 bubble kits. rineU HAyUibe Salary expense Depreciation experise Ront expense Uulify exponse Total expenses Operating incorne (Afler you hit coninae the ccreen may tnke you below the beginning of the next step. If so, Bcroll back up to the top of the step. (After you hit confinue the screen may take you below the beginning of the next step. If so, sctoll back up to the top of the step.) Requirement 2. Graph the behavior of the company's total costs. Use total costs on the y-axis and volume (in thousands of bubble kits) on the x-axis. Begin by plotting the total costs for volume levels of 65,000,70,000, and 75,000khts, (Enlarge the graph to medium size and use the point tool button displayed to draw the graph.) Soletr revende Variable expenses: Cost of goods sold Sales commissions: Ublity expenso Foced oxponses: Selary expense Depreclation expense Rent experise Utility expense
Step by Step Solution

There are 3 Steps involved in it

Step: 1

blur-text-image

Get Instant Access to Expert-Tailored Solutions

See step-by-step solutions with expert insights and AI powered tools for academic success

Step: 2

blur-text-image

Step: 3

blur-text-image

Ace Your Homework with AI

Get the answers you need in no time with our AI-driven, step-by-step assistance

Get Started

Recommended Textbook for

Audit Of The Drug Enforcement Administrations Controls Over Seized And Collected Drugs

Authors: Office Of Inspector General, U.S. Department Of Justice, Penny Hill Press

1st Edition

1537075683, 978-1537075686

More Books

Students also viewed these Accounting questions

Question

5. Prepare for the role of interviewee

Answered: 1 week ago

Question

6. Secure job interviews and manage them with confidence

Answered: 1 week ago