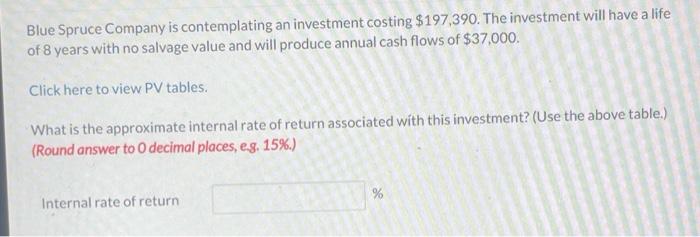
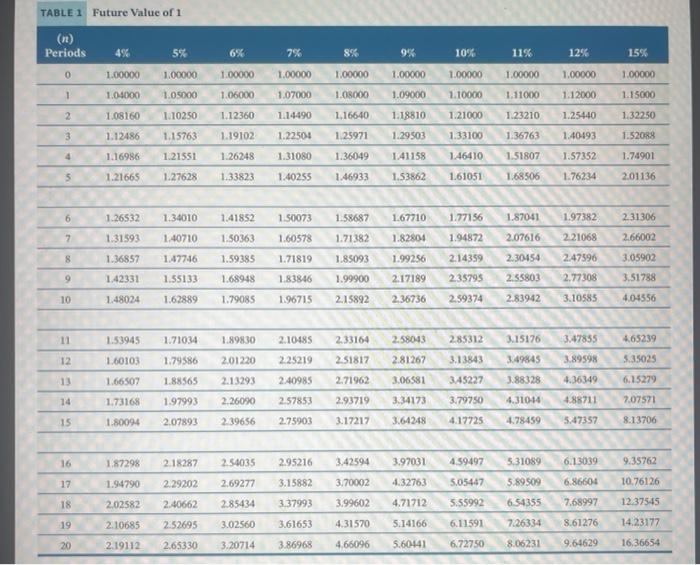
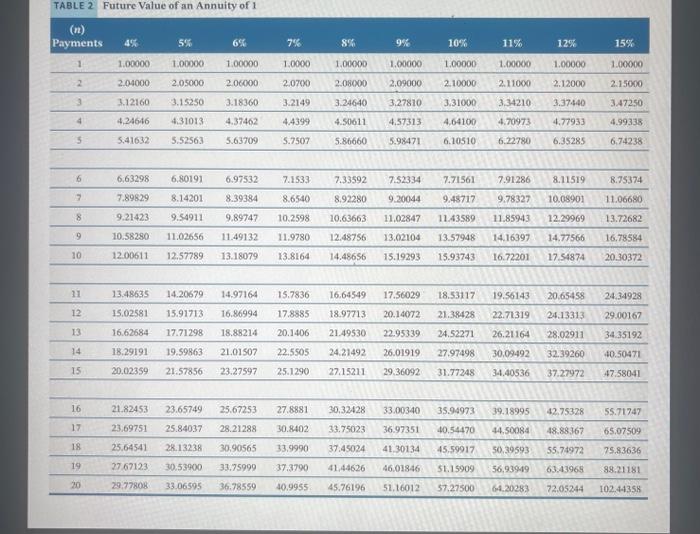
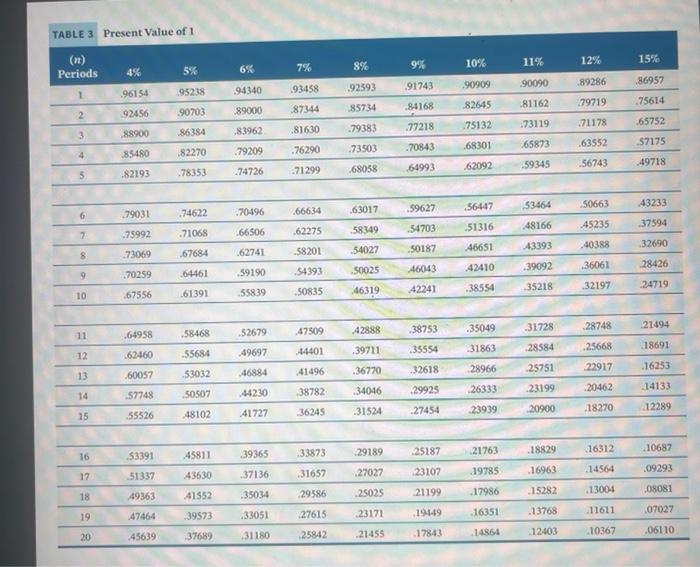
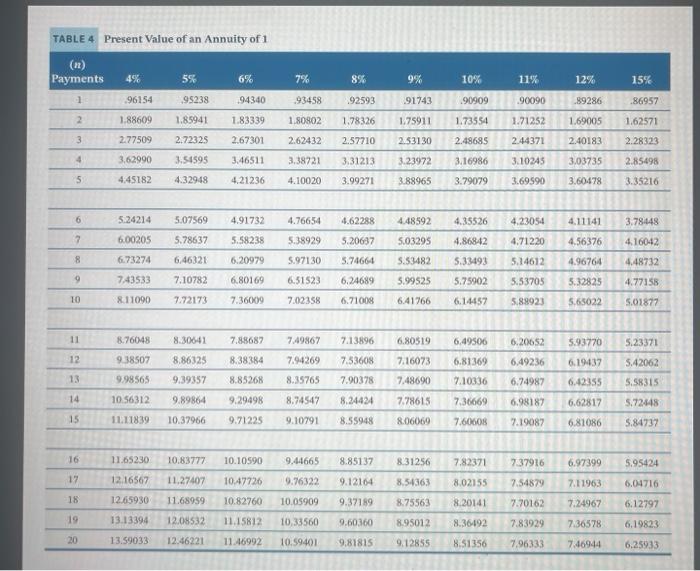
Blue Spruce Company is contemplating an investment costing $197,390. The investment will have a life of 8 years with no salvage value and will produce annual cash flows of $37,000. Click here to view PV tables. What is the approximate internal rate of return associated with this investment? (Use the above table.) (Round answer to 0 decimal places, es. 15\%.) Internal rate of return % TABLE 1 Future Value of 1 \begin{tabular}{ccccccccccc} \hline (n)Periods & 4% & 5% & 6% & 7% & 8% & 9% & 10% & 11% & 12% & 15% \\ \hline 0 & 1.00000 & 1.00000 & 1.00000 & 1.00000 & 1.00000 & 1.00000 & 1.00000 & 1.00000 & 1.00000 & 1.00000 \\ \hline 1 & 1.04000 & 1.05000 & 1.06000 & 1.07000 & 1.08000 & 1.09000 & 1.10000 & 1.11000 & 1.12000 & 1.15000 \\ \hline 2 & 1.08160 & 1.10250 & 1.12360 & 1.14490 & 1.16640 & 1.18810 & 1.21000 & 1.23210 & 1.25440 & 1.32250 \\ \hline 3 & 1.12486 & 1.15763 & 1.19102 & 1.22504 & 1.25971 & 1.29503 & 1.33100 & 1.36763 & 1.40493 & 1.52088 \\ \hline 4 & 1.16986 & 1.21551 & 1.26248 & 1.31080 & 1.36049 & 1.41158 & 1.46410 & 1.51807 & 1.57352 & 1.74901 \\ \hline 5 & 1.21665 & 1.27628 & 1.33823 & 1.40255 & 1.46933 & 1.53862 & 1.61051 & 1.68506 & 1.76234 & 2.01136 \\ \hline \end{tabular} \begin{tabular}{lllllllllll} \hline 6 & 1.26532 & 1.34010 & 1.41852 & 1.50073 & 1.58687 & 1.67710 & 1.77156 & 1.87041 & 1.97382 & 231306 \\ \hline 7 & 1.31593 & 1.40710 & 1.50363 & 1.60578 & 1.71382 & 1.82804 & 1.94872 & 2.07616 & 2.21068 & 2.66002 \\ \hline 8 & 1.36857 & 1.47746 & 1.59385 & 1.71819 & 1.85093 & 1.99256 & 2.14359 & 2.30454 & 2.47596 & 3.05902 \\ \hline 9 & 1.42331 & 1.55133 & 1.68948 & 1.83846 & 1.99900 & 2.17189 & 235795 & 2.55803 & 2.77308 & 3.51788 \\ \hline 10 & 1.48024 & 1.62889 & 1.79085 & 1.96715 & 2.15892 & 2.36736 & 2.59374 & 2.83942 & 3.10585 & 4.04556 \\ \hline \end{tabular} \begin{tabular}{lllllllllll} \hline 11 & 1.53945 & 1.71034 & 1.89830 & 2.10485 & 2.33164 & 2.58043 & 2.85312 & 3.15176 & 3.47855 & 4.65239 \\ \hline 12 & 1.60103 & 1.79586 & 2.01220 & 2.25219 & 2.51817 & 2.81267 & 3.13843 & 3.49845 & 3.89598 & 5.35025 \\ \hline 13 & 1.66507 & 1.88565 & 2.13293 & 2.40985 & 2.71962 & 3.06581 & 3.45227 & 3.88328 & 4.36349 & 6.15279 \\ \hline 14 & 1.73168 & 1.97993 & 2.26090 & 2.57853 & 2.93719 & 3.34173 & 3.79750 & 4.31044 & 4.88711 & 2.07571 \\ \hline 15 & 1.80094 & 2.07893 & 2.39656 & 2.75903 & 3.17217 & 3.64248 & 4.17725 & 4.78459 & 5.47357 & 8.13706 \\ \hline \end{tabular} \begin{tabular}{lllllllllll} \hline 16 & 1.87298 & 2.18287 & 2.54035 & 2.95216 & 3.42594 & 3.97031 & 4.59497 & 5.31059 & 6.13039 & 9.35762 \\ \hline 17 & 1.94790 & 2.29202 & 2.69277 & 3.15882 & 3.70002 & 4.32763 & 5.05447 & 5.89509 & 6.86604 & 10.76126 \\ \hline 18 & 2.02582 & 2.40662 & 2.85434 & 3.37993 & 3.99602 & 4.71712 & 5.55992 & 6.54355 & 7.68997 & 12.37545 \\ \hline 19 & 2.10685 & 2.52695 & 3.02560 & 3.61653 & 4.31570 & 5.14166 & 6.11591 & 7.26334 & 8.61276 & 14.23177 \\ \hline 20 & 2.19112 & 2.65330 & 3.20714 & 3.86968 & 4.66096 & 5.60441 & 6.72750 & 8.06231 & 9.64629 & 16.36654 \\ \hline \end{tabular} TABLE 2 Future Value of an Annuity of 1 \begin{tabular}{rrrrrrrrr|r|r} \hline 6 & 6.63298 & 6.80191 & 6.97532 & 7.1533 & 7.33592 & 7.52334 & 7.71561 & 7.91286 & 8.11519 & 8.75374 \\ \hline 7 & 7.89829 & 8.14201 & 8.39384 & 8.6540 & 8.92280 & 9.20044 & 9.45717 & 9.78327 & 10.08901 & 11.06680 \\ \hline 8 & 9.21423 & 9.54911 & 9.89747 & 10.2598 & 10.63663 & 11.02847 & 11.43589 & 11.85943 & 12.29969 & 13.72682 \\ \hline 9 & 10.58280 & 11.02656 & 11.49132 & 11.9780 & 12.48756 & 13.02104 & 13.57948 & 14.16397 & 14.77566 & 16.78584 \\ \hline 10 & 12.00611 & 12.57789 & 13.18079 & 13.8164 & 14.48656 & 15.19293 & 15.93743 & 16.72201 & 17.54874 & 20.30372 \\ \hline \end{tabular} TABLE 3 Present Value of 1 Present Value of an Annuitv of 1
