Answered step by step
Verified Expert Solution
Question
1 Approved Answer
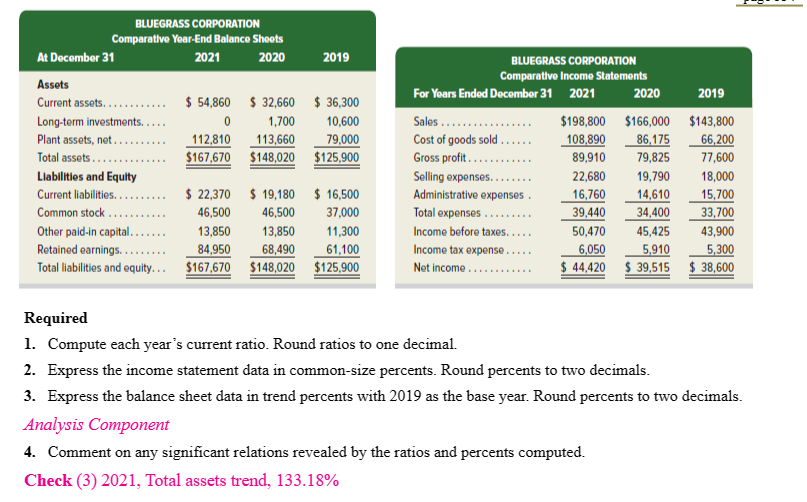
BLUEGRASS CORPORATION Comparative Year-End Balance Sheets At December 31 2021 2020 2019 Assets Current assets.......$ 54,860 $ 32,660 $36,300 Long-term investments.. 0 1,700 10,600

BLUEGRASS CORPORATION Comparative Year-End Balance Sheets At December 31 2021 2020 2019 Assets Current assets.......$ 54,860 $ 32,660 $36,300 Long-term investments.. 0 1,700 10,600 BLUEGRASS CORPORATION Comparative Income Statements For Years Ended December 31 2021 Sales... Plant assets, net.. Total assets.... 112,810 113,660 79,000 $167,670 $148,020 $125,900 Cost of goods sold...... Gross profit......... 108,890 86,175 2020 2019 $198,800 $166,000 $143,800 66,200 89,910 79,825 77,600 Liabilities and Equity Selling expenses........ 22,680 19,790 18,000 Current liabilities....... $22,370 $19,180 $16,500 Administrative expenses. 16,760 14,610 15,700 Common stock. 46,500 46,500 37,000 Total expenses... 39,440 34,400 33,700 Other paid-in capital... 13,850 13,850 11,300 Income before taxes..... 50,470 45,425 43,900 Retained earnings... 84,950 68,490 61,100 Total liabilities and equity... $167,670 $148,020 $125,900 Income tax expense.... Net income........ 6,050 5,910 5,300 $44,420 $39,515 $38,600 Required 1. Compute each year's current ratio. Round ratios to one decimal. 2. Express the income statement data in common-size percents. Round percents to two decimals. 3. Express the balance sheet data in trend percents with 2019 as the base year. Round percents to two decimals. Analysis Component 4. Comment on any significant relations revealed by the ratios and percents computed. Check (3) 2021, Total assets trend, 133.18%
Step by Step Solution
There are 3 Steps involved in it
Step: 1

Get Instant Access to Expert-Tailored Solutions
See step-by-step solutions with expert insights and AI powered tools for academic success
Step: 2

Step: 3

Ace Your Homework with AI
Get the answers you need in no time with our AI-driven, step-by-step assistance
Get Started


