Answered step by step
Verified Expert Solution
Question
1 Approved Answer
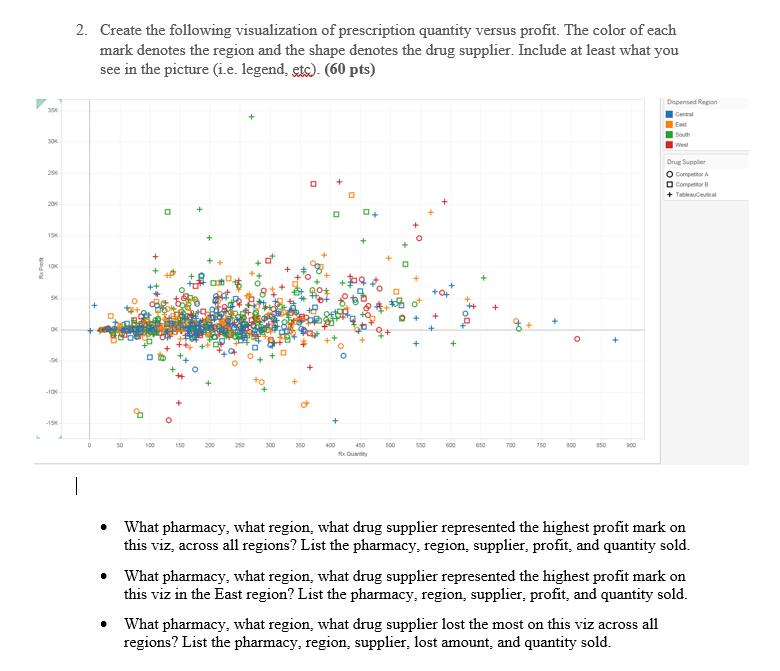
BON 350 30 29 20x 15K 10K SK OK SK -10K -15 2. Create the following visualization of prescription quantity versus profit. The color

BON 350 30 29 20x 15K 10K SK OK SK -10K -15 2. Create the following visualization of prescription quantity versus profit. The color of each mark denotes the region and the shape denotes the drug supplier. Include at least what you see in the picture (i.e. legend, etc). (60 pts) 1 0 50 . 100 D 150 250 300 350 0 + 0 + 400 0 0+ +$4 to 450 8x Quarity 500 550 + 16:00 650 + of + 700 750 + 800 850 900 Dispensed Region -- What pharmacy, what region, what drug supplier lost the most on this viz across all regions? List the pharmacy, region, supplier, lost amount, and quantity sold. South West Drug Suppler O Compr Compet + Tableau What pharmacy, what region, what drug supplier represented the highest profit mark on this viz, across all regions? List the pharmacy, region, supplier, profit, and quantity sold. What pharmacy, what region, what drug supplier represented the highest profit mark on this viz in the East region? List the pharmacy, region, supplier, profit, and quantity sold.
Step by Step Solution
There are 3 Steps involved in it
Step: 1
Question 1 What pharmacy what region what drug supplier represented the highest profit mark on this ...
Get Instant Access to Expert-Tailored Solutions
See step-by-step solutions with expert insights and AI powered tools for academic success
Step: 2

Step: 3

Ace Your Homework with AI
Get the answers you need in no time with our AI-driven, step-by-step assistance
Get Started


