

Question
Bond Pricer: Construct an Excel spread-sheet that uses the input variables below (you may assume realistic values of your choice): Trade date Spot rate curve
Bond Pricer: Construct an Excel spread-sheet that uses the input variables below (you may assume realistic values of your choice):
Trade date
Spot rate curve
Coupon rate
Coupon frequency (semi-annual or annual)
Maturity (up to 10 years)
Current price
(a) Compute the Yield to Maturity (YTM). You may use the built-in excel function to calculate the YTM.
(b) Verify the accuracy of the YtM computed in (a) by recalculating the bond price as a sum of discounted cash-flows (i.e. using the arbitrage-free valuation approach).
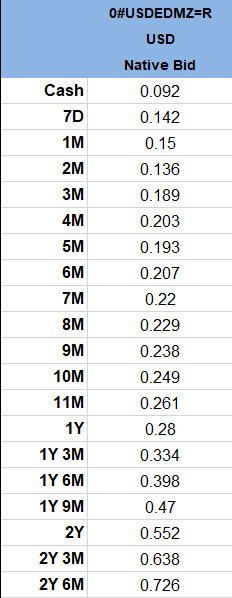
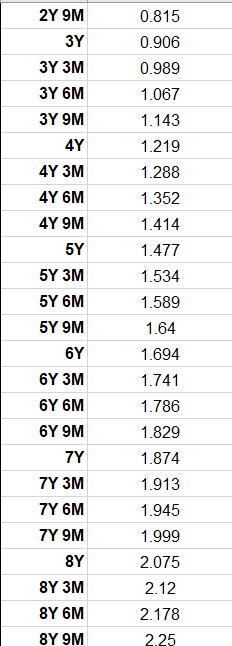
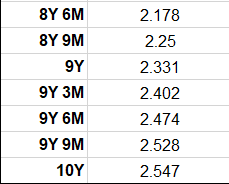
Spot rate curve provided below:
Step by Step Solution
There are 3 Steps involved in it
Step: 1

Get Instant Access to Expert-Tailored Solutions
See step-by-step solutions with expert insights and AI powered tools for academic success
Step: 2

Step: 3
Ace Your Homework with AI
Get the answers you need in no time with our AI-driven, step-by-step assistance
Get Started
Valuation Measuring and managing the values of companies
Authors: Mckinsey, Tim Koller, Marc Goedhart, David Wessel
5th edition
978-0470424650, 9780470889930, 470424656, 470889934, 978-047042470