Answered step by step
Verified Expert Solution
Link Copied!

Question

1 Approved Answer

[Bonus Question 1]. Consider the following figures showing the top, bottom, and feed lines. The left figure shows the situations under different reflux ratios, and
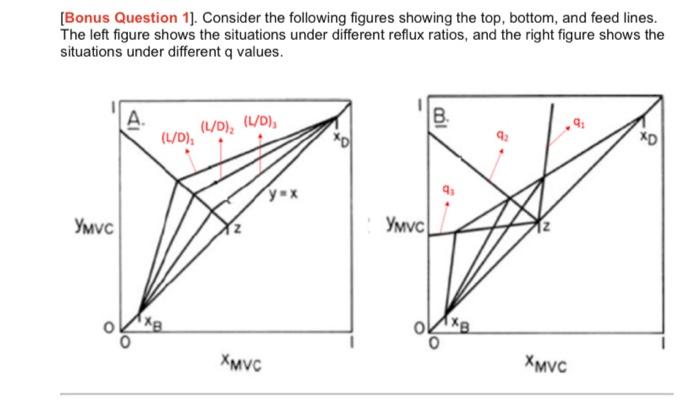
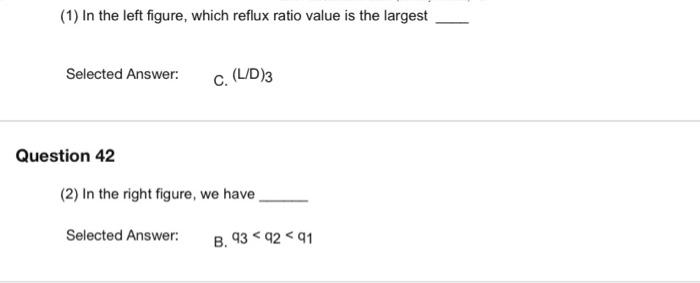
image text in transcribed
[Bonus Question 1]. Consider the following figures showing the top, bottom, and feed lines. The left figure shows the situations under different reflux ratios, and the right figure shows the situations under different q values. (1) In the left figure, which reflux ratio value is the largest Selected Answer: C. (L/D)3 estion 42 (2) In the right figure, we have Selected Answer: B. q3

Step by Step Solution

There are 3 Steps involved in it

Step: 1

blur-text-image

Get Instant Access to Expert-Tailored Solutions

See step-by-step solutions with expert insights and AI powered tools for academic success

Step: 2

blur-text-image

Step: 3

blur-text-image

Ace Your Homework with AI

Get the answers you need in no time with our AI-driven, step-by-step assistance

Get Started

Recommended Textbook for

Chemical Engineering For Non Chemical Engineers

Authors: Jack Hipple

1st Edition

1119169585, 978-1119169581

More Books

Students also viewed these Chemical Engineering questions

Question

8. Document data as evidence in complete and detailed notes.

Answered: 1 week ago