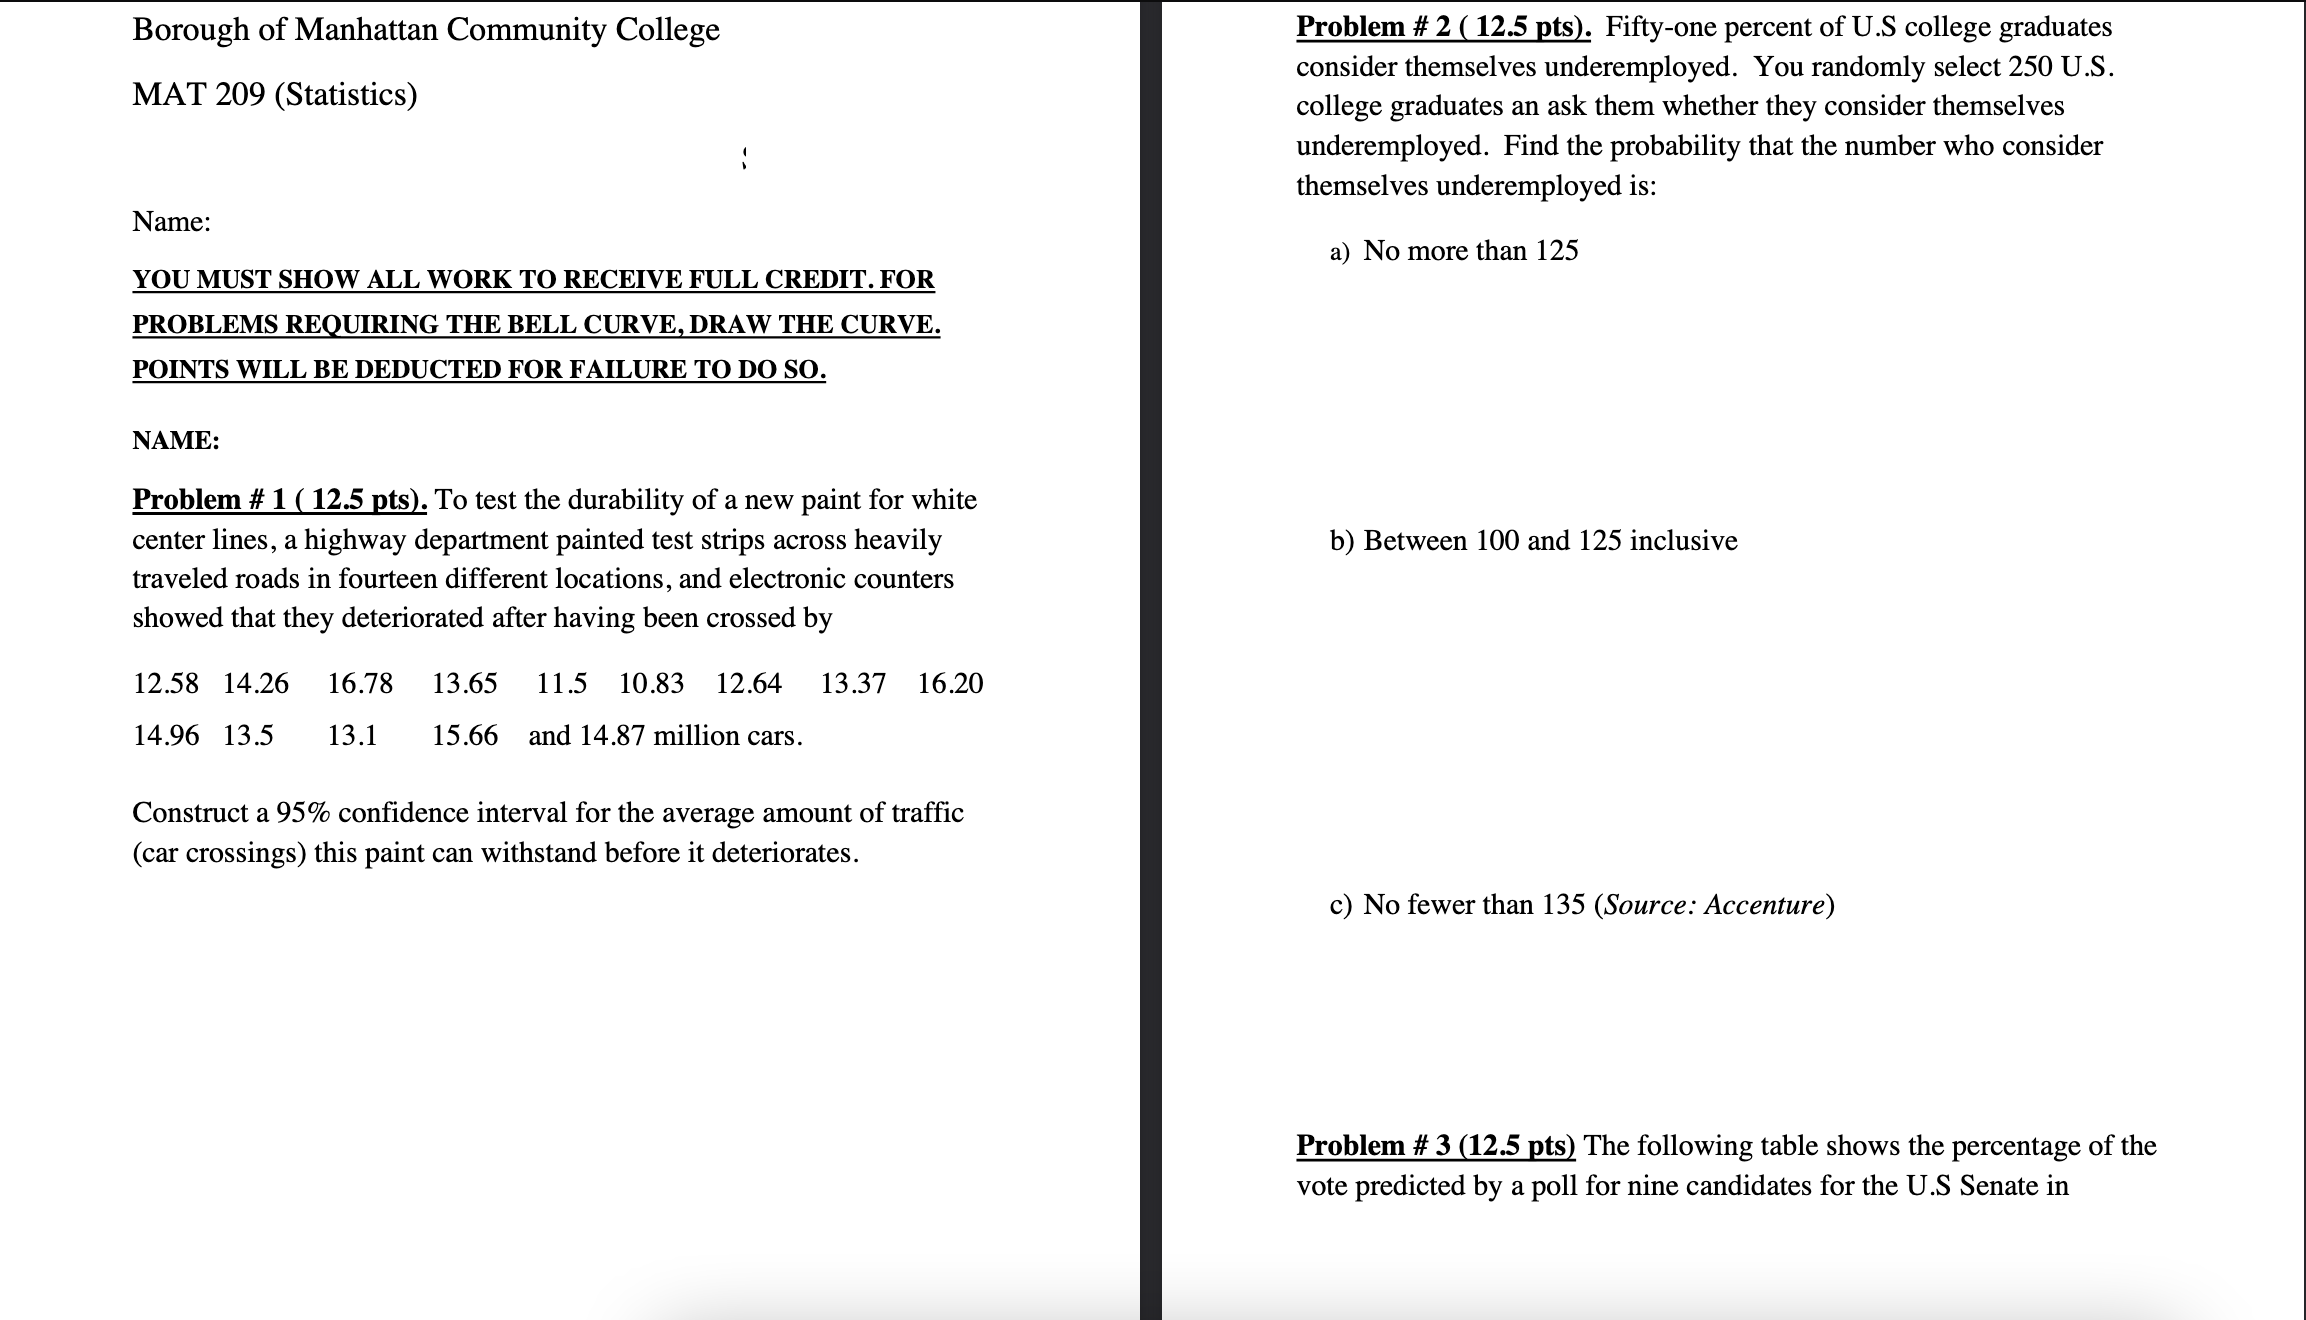
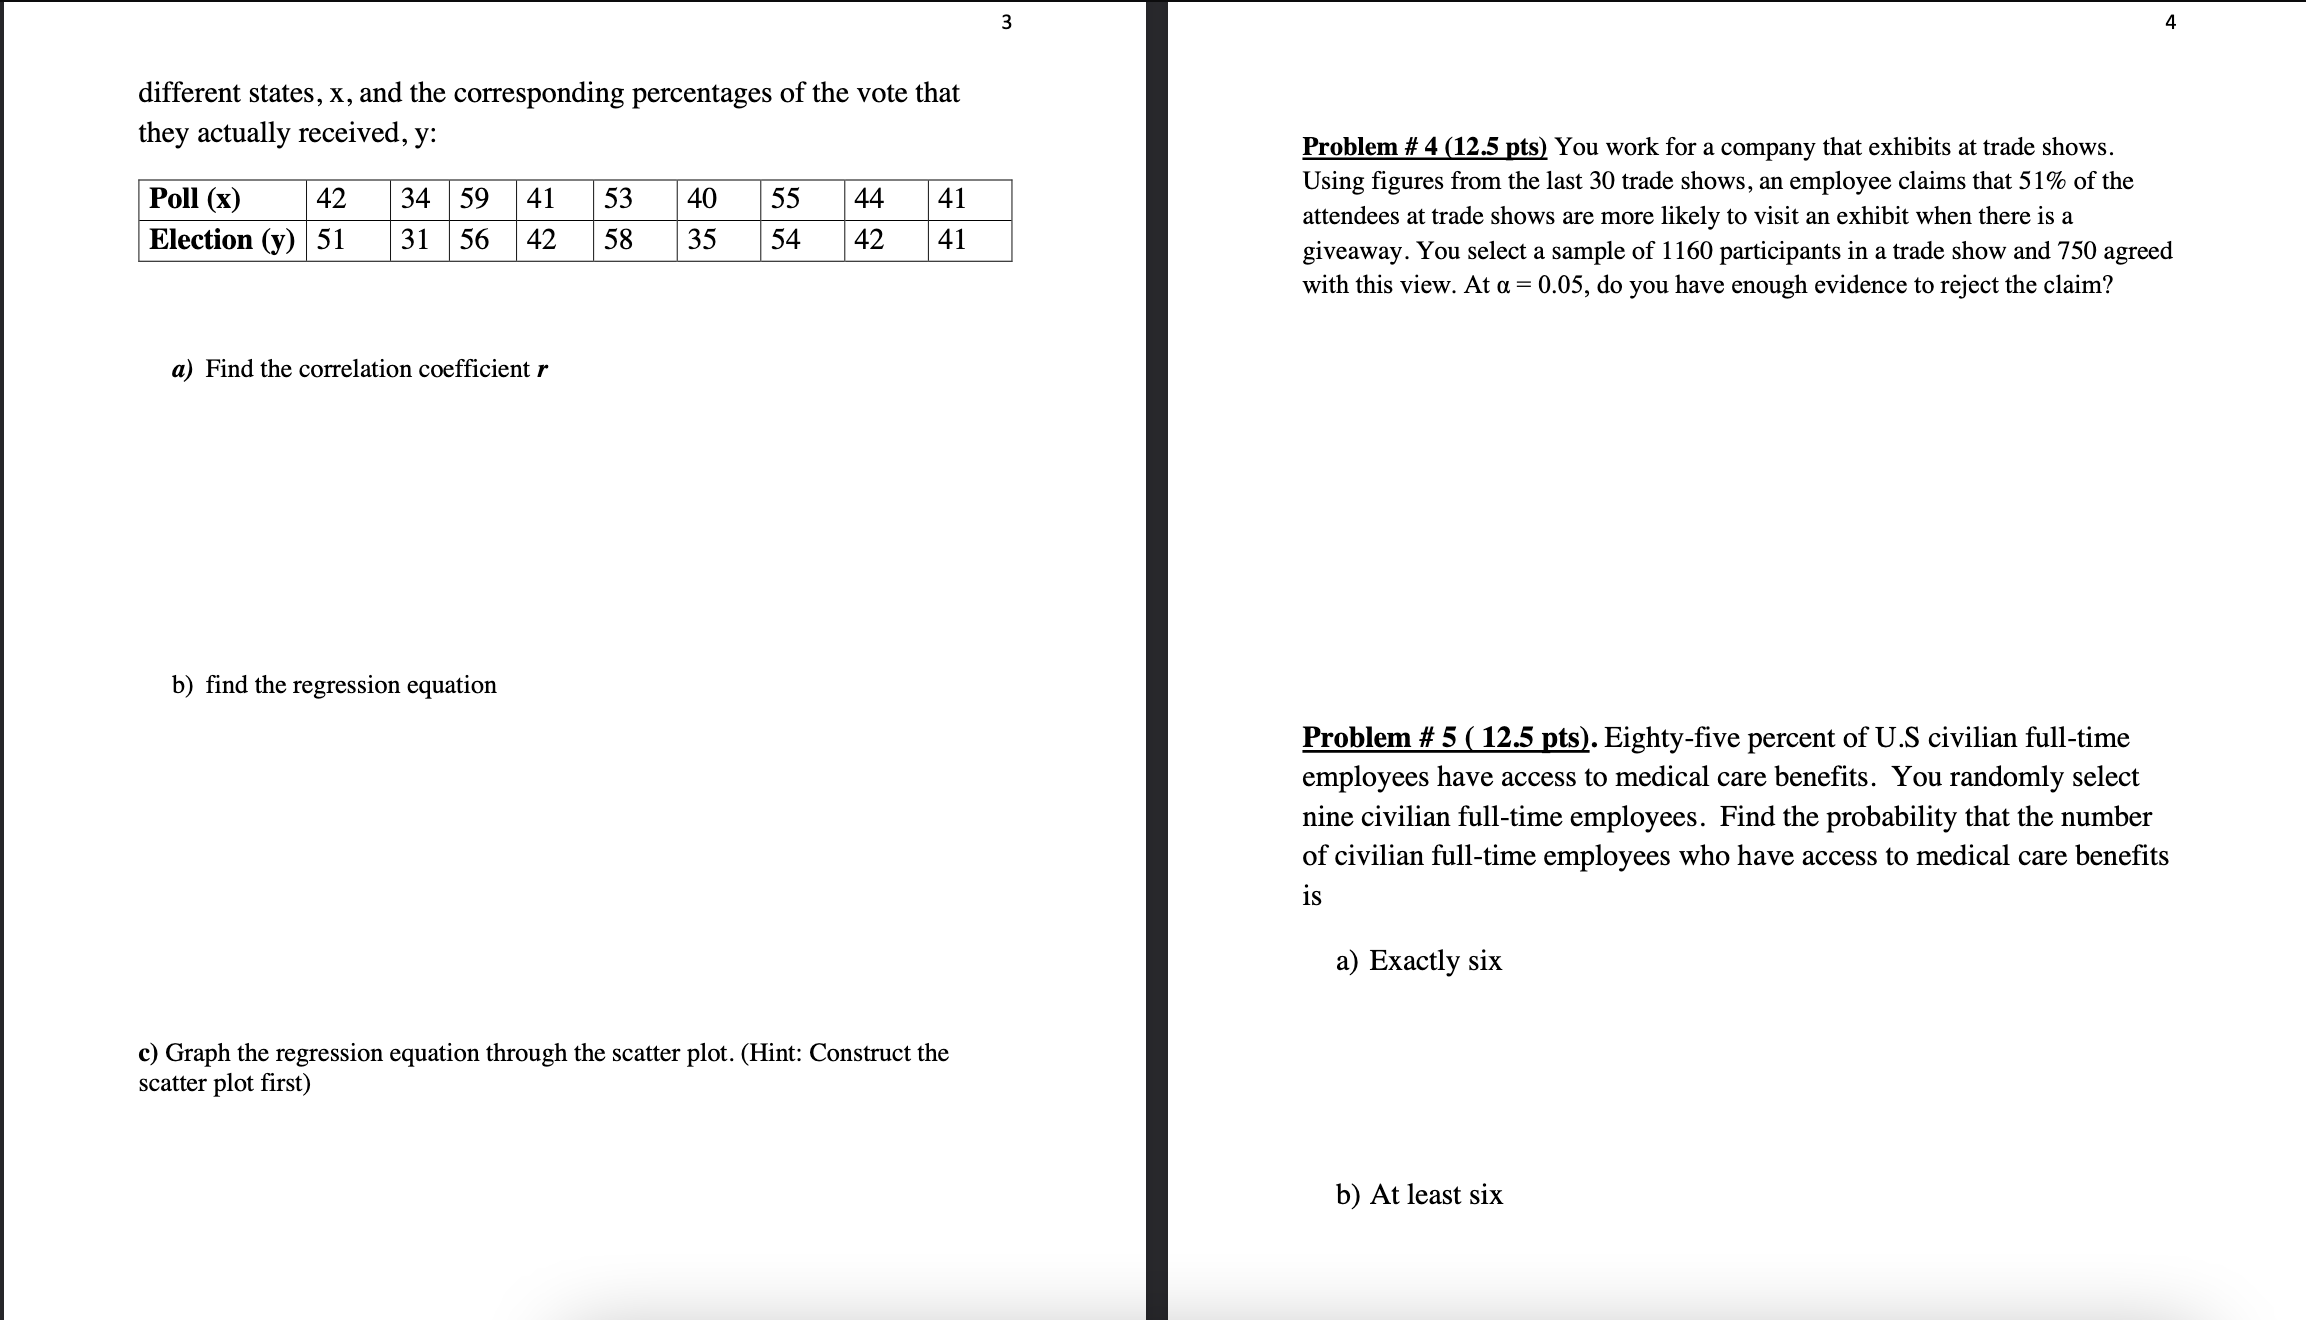
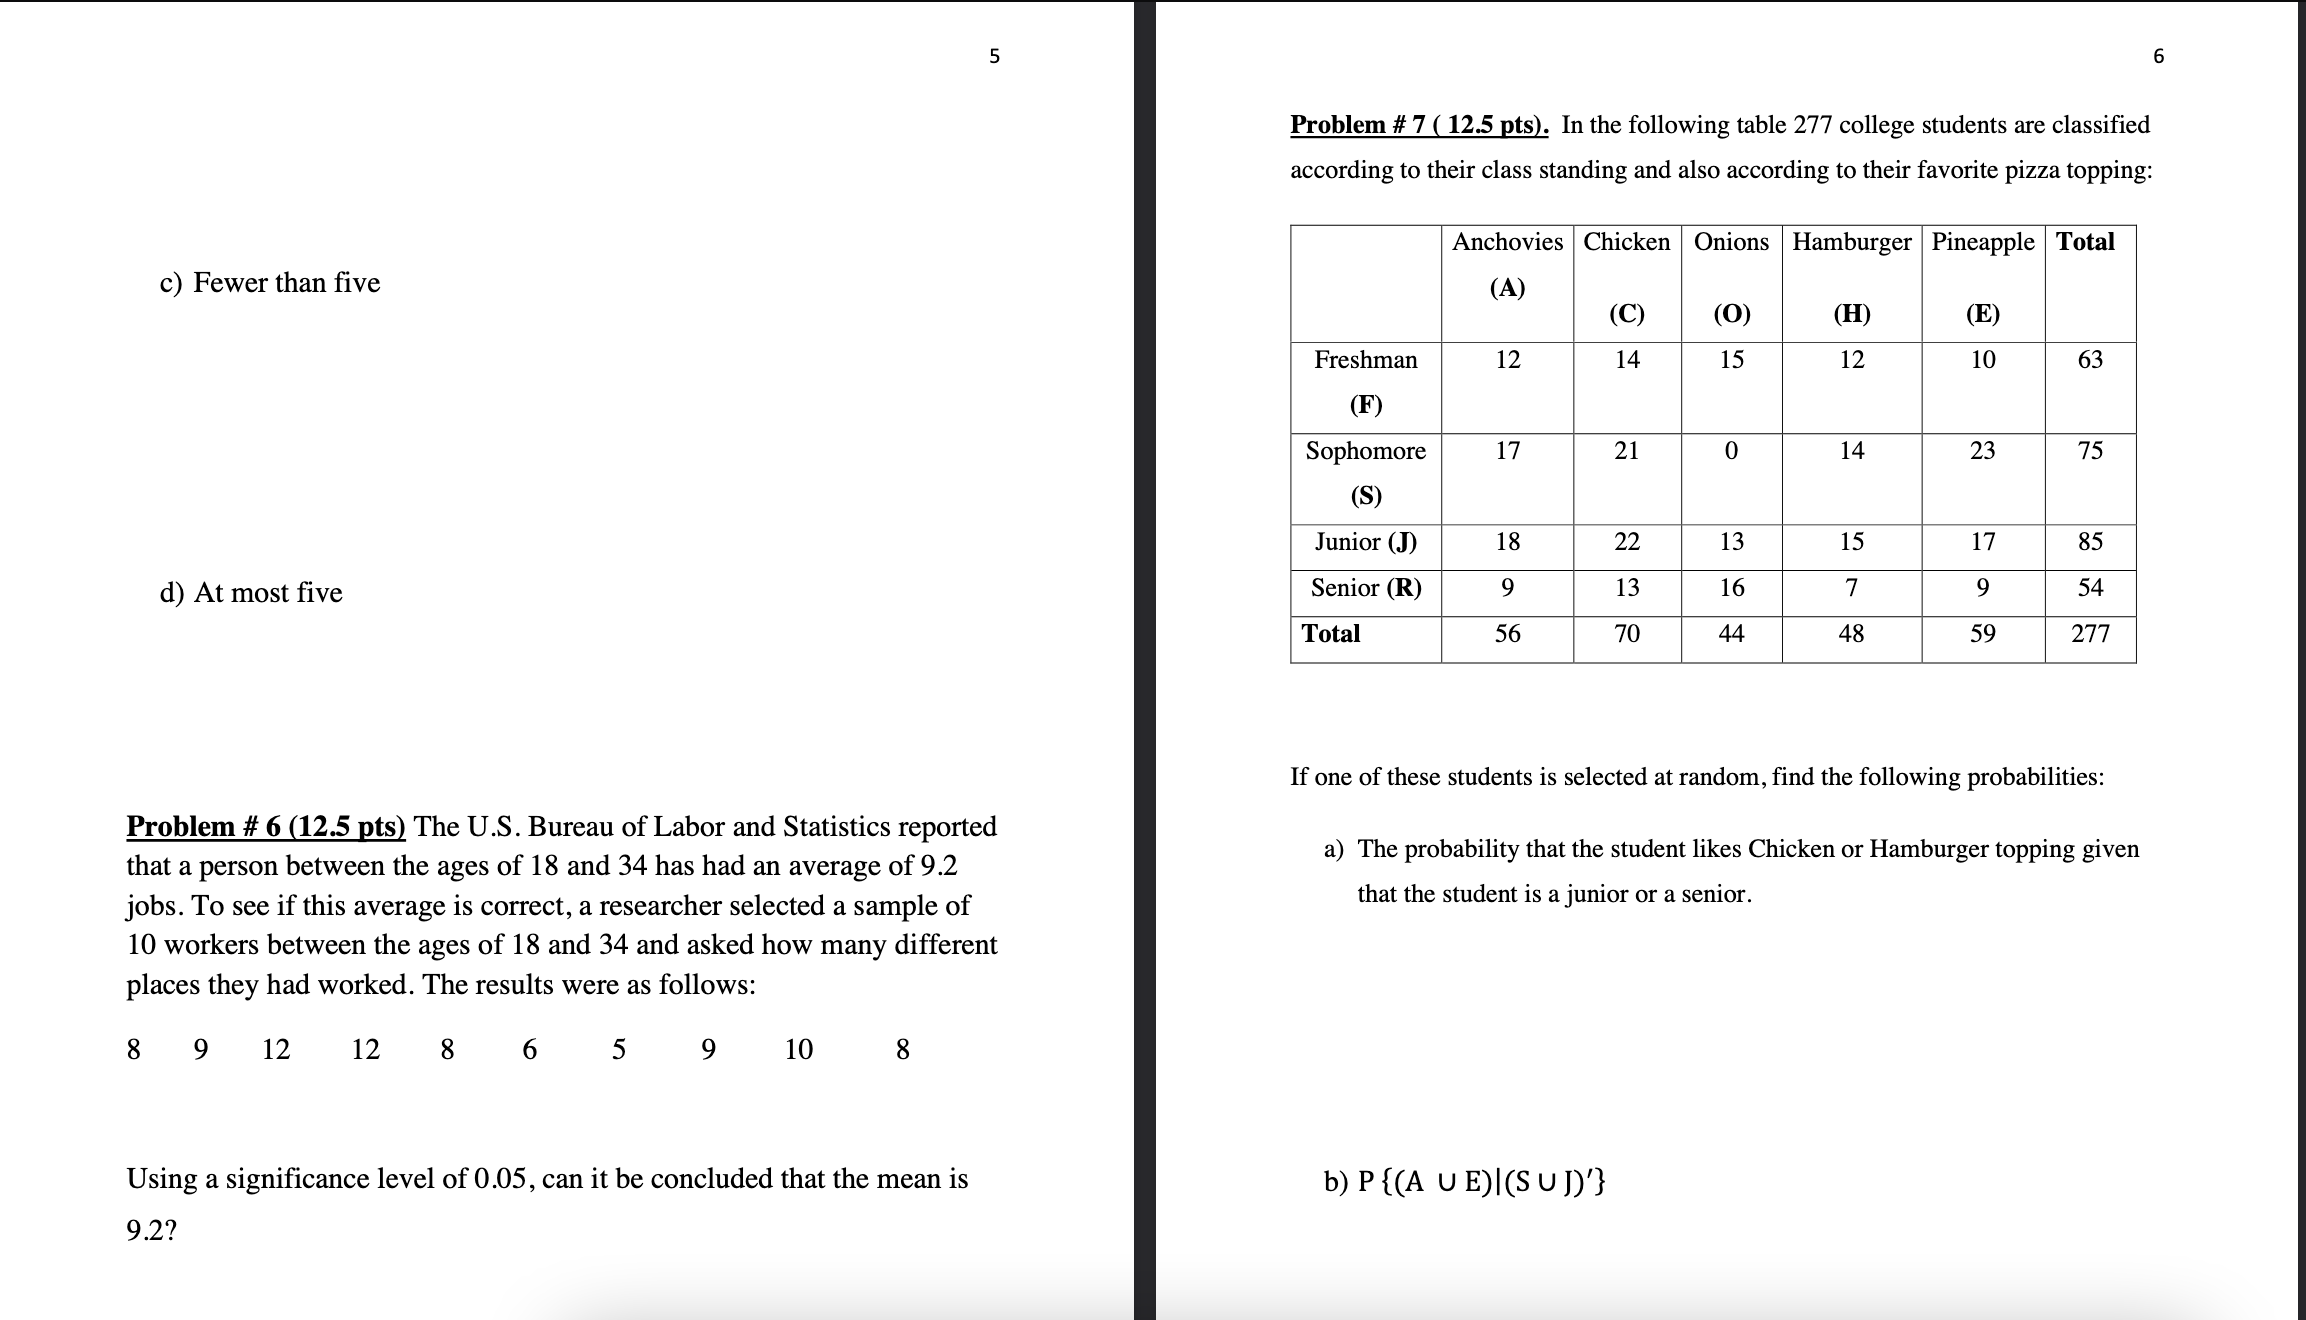
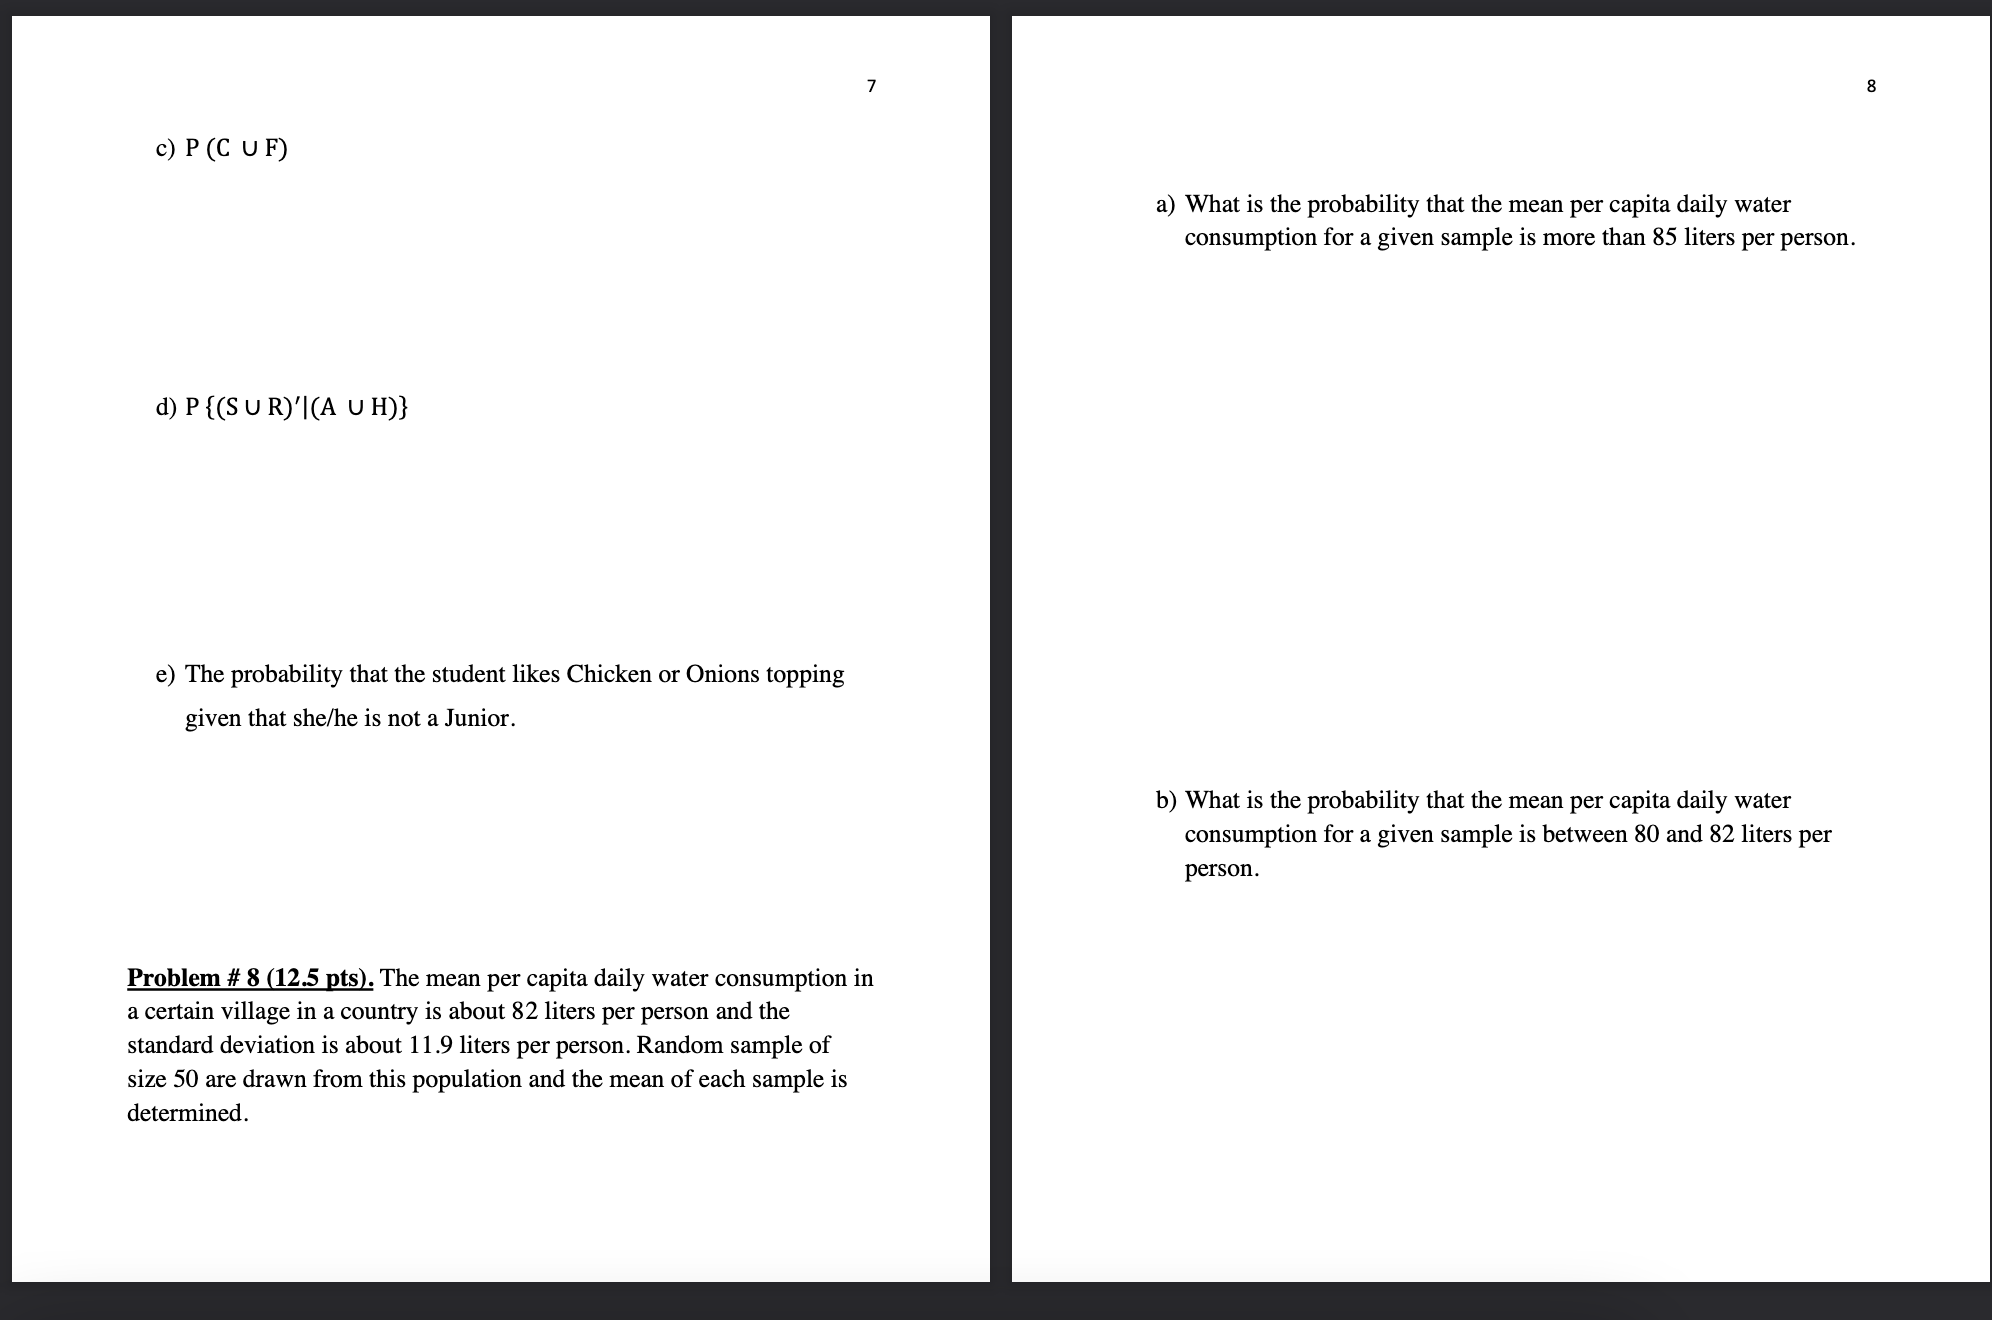
Borough of Manhattan Community College MAT 209 (Statistics) 1 : Name: YOU MUST SHOW ALL WORK TO RECEIVE FULL CREDIT. FOR PROBLEMS REQUIRING THE BELL CURVE, DRAW THE CURVE. POINTS WILL BE DEDUCTED FOR FAILURE TO DO SO. NAME: Problem # 1 1 125 pts!. To test the durability of a new paint for white center lines, a highway department painted test strips across heavily traveled roads in fourteen different locations, and electronic counters showed that they deteriorated after having been crossed by 125814.26 16.78 13.65 11.5 10.83 12.64 13.37 16.20 14.96 13.5 13.1 15.66 and 14.87millioncars. Construct a 95% condence interval for the average amount of traffic (car crossings) this paint can withstand before it deteriorates. Problem # 2 g 12.5 ptsl. Fifty-one percent of US college graduates consider themselves underemployed. You randomly select 250 US. college graduates an ask them whether they consider themselves underemployed. Find the probability that the number who consider themselves underemployed is: a) No more than 125 b) Between 100 and 125 inclusive c) No fewer than 135 (Source: Accenture) Problem # 3 1125 pts! The following table shows the percentage of the vote predicted by a poll for nine candidates for the US Senate in Borough of Manhattan Community College MAT 209 (Statistics) 1 : Name: YOU MUST SHOW ALL WORK TO RECEIVE FULL CREDIT. FOR PROBLEMS REQUIRING THE BELL CURVE, DRAW THE CURVE. POINTS WILL BE DEDUCTED FOR FAILURE TO DO SO. NAME: Problem # 1 1 125 pts!. To test the durability of a new paint for white center lines, a highway department painted test strips across heavily traveled roads in fourteen different locations, and electronic counters showed that they deteriorated after having been crossed by 125814.26 16.78 13.65 11.5 10.83 12.64 13.37 16.20 14.96 13.5 13.1 15.66 and 14.87millioncars. Construct a 95% condence interval for the average amount of traffic (car crossings) this paint can withstand before it deteriorates. Problem # 2 g 12.5 ptsl. Fifty-one percent of US college graduates consider themselves underemployed. You randomly select 250 US. college graduates an ask them whether they consider themselves underemployed. Find the probability that the number who consider themselves underemployed is: a) No more than 125 b) Between 100 and 125 inclusive c) No fewer than 135 (Source: Accenture) Problem # 3 1125 pts! The following table shows the percentage of the vote predicted by a poll for nine candidates for the US Senate in 3 different states, x, and the corresponding percentages of the vote that they actually received, y: Problem # 4 (12.5 pts) You work for a company that exhibits at trade shows. Poll (x) 42 34 59 41 53 40 55 44 41 Using figures from the last 30 trade shows, an employee claims that 51% of the attendees at trade shows are more likely to visit an exhibit when there is a Election (y) 51 31 56 42 58 35 54 42 41 giveaway. You select a sample of 1160 participants in a trade show and 750 agreed with this view. At a = 0.05, do you have enough evidence to reject the claim? a) Find the correlation coefficient r b) find the regression equation Problem # 5 ( 12.5 pts). Eighty-five percent of U.S civilian full-time employees have access to medical care benefits. You randomly select nine civilian full-time employees. Find the probability that the number of civilian full-time employees who have access to medical care benefits is a) Exactly six c) Graph the regression equation through the scatter plot. (Hint: Construct the scatter plot first) b) At least sixc) Fewer than ve d) At most ve Problem # 6 112.5 ts! The US. Bureau of Labor and Statistics reported that a person between the ages of 18 and 34 has had an average of 9.2 jobs. To see if this average is correct, a researcher selected a sample of 10 workers between the ages of 18 and 34 and asked how many different places they had worked. The results were as follows: 8 9 12 12 8 6 5 9 10 8 Using a signicance level of 0.05, can it be concluded that the mean is 9.2? Problem # 7 g 12.5 ptsl. In the following table 277 college students are classified according to their class standing and also according to their favorite pizza topping: Anchovies Chicken Onions Hamburger Pineapple Total (A) (C) (0) (H) (E) Freshman 12 14 15 12 10 63 (F) Sophomore 17 21 0 14 23 75 (S) Junior (J) 18 22 13 15 17 85 Senior (R) 9 13 16 7 9 54 Total 56 70 44 48 59 277 If one of these students is selected at random, find the following probabilities: a) The probability that the student likes Chicken or Hamburger topping given that the student is a junior or a senior. b) P {(A U E)|(5 U I)'} a) What is the probability that the mean per capita daily water consumption for a given sample is more than 85 liters per person. d) P {(5 U R)'|(A U 1'0} e) The probability that the student likes Chicken or Onions topping given that she/he is not a Junior. b) What is the probability that the mean per capita daily water consumption for a given sample is between 80 and 82 liters per person. Problem # 8 112.5 ts I. The mean per capita daily water consumption in a certain village in a country is about 82 liters per person and the standard deviation is about 119 liters per person. Random sample of size 50 are drawn from this population and the mean of each sample is determined
