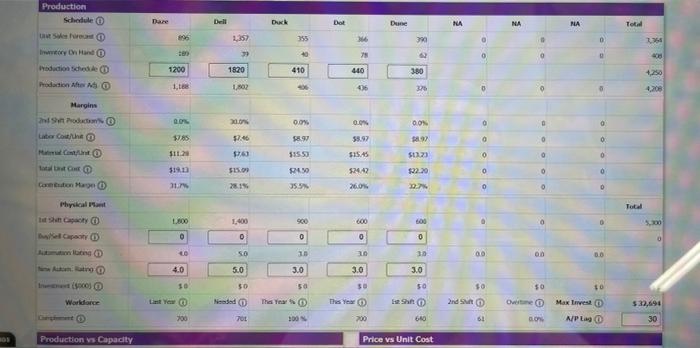
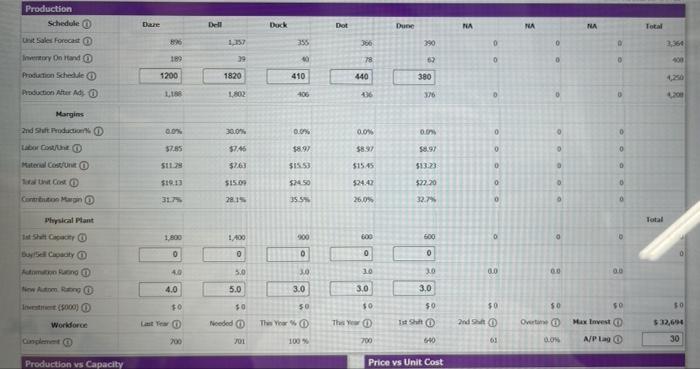
BOS Production Ust Sales Forecast Inventory On Hand ( Production Schedule Production After A Margins and Shift Production% Labor Cost/Unit @ Matal Cont/int Total List Cot Connubion Margn at Shift Capacity Capacity Automation Rating ( Auto Rating Int($000) Workforce Production vs Capacity an Schedule O Physical Plant Daze 968 1200 1,188 0.0% $7.85 $11.20 $19.13 31,7% 1,800 0 40 4.0 10 Last Yew ( 700 1,357 39 1820 1,802 30.0% $7.46 $763 $15.09 28.1% 1,400 0 5.0 5.0 50 Nended ( 701 Duck 355 40 410 0.0% $15.53 $24.50 35.5% 900 0 30 The Year 3.0 50 100% Dot 366 78 440 436 0.0% $5.97 $15.45 $24.42 26.0% 600 0 3.0 3.0 30 Dune This Year 390 62 380 376 0.0% $8.97 $13.23 $22.20 22.7% 600 0 3.0 50 1st Shift ( 700 640 Price vs Unit Cost 3.0 NA 0 0 2nd Shift 0 0 0 8 0.0 05 19 NA D Overtime 0 0 0 00 05 0.0% VN 0 0 0 0 0 10 Max Invest ( A/P Lag Total Total 3,364 405 4,250 4,208 5,300 0 $32,694 30 Production Schedule Unt Sales Forecast Inventory On Hand Production Schedule Production After Ads Margins 2nd Shift Production Labor Cost/Unit Material Cost/Unit Total Unit Cost O Contribution Margin 1st Shift Capacity BuySell Capacity Automation Rating New Autom. Rating O Investment (5000) Workforce Complement Production vs Capacity Physical Plant Daze 189 1200 1,188 0.0% $7.85 $11.29 $19.13 31.7% 1,800 0 Last Year 4.0 4.0 10 200 Dell 4,357 39 1820 1,802 30.0% $7.46 $2.63 $15.09 28.1% 1,400 0 5.0 5.0 Needed $0 701 Dock 355 40 410 406 0.0% $8.97 $15.53 $24.50 35.5% 900 0 3.0 3.0 50 100 % This Year % Dot 366 78 440 436 0.0% $8.37 $15.45 $24.42 26.0% 600 0 3.0 3.0 This Year $0 Dune 700 390 29 380 376 0.0% $8.97 $13.23 $22,20 32.7% 009 0 3.0 3.0 $0 1st Shift 6:40 Price vs Unit Cost NA NA 0 0 D 0 ..... ..... 0 0.0 50 2nd Shift ( 63 0 Overtine 0 0 0 0.0 50 0.0% NA Max Invest A/P Lag 0 0 a 0 0 0 0 0 0 0.0 05 Total Total 3,364 400 4,250 4,200 $0 $32,694 30 BOS Production Ust Sales Forecast Inventory On Hand ( Production Schedule Production After A Margins and Shift Production% Labor Cost/Unit @ Matal Cont/int Total List Cot Connubion Margn at Shift Capacity Capacity Automation Rating ( Auto Rating Int($000) Workforce Production vs Capacity an Schedule O Physical Plant Daze 968 1200 1,188 0.0% $7.85 $11.20 $19.13 31,7% 1,800 0 40 4.0 10 Last Yew ( 700 1,357 39 1820 1,802 30.0% $7.46 $763 $15.09 28.1% 1,400 0 5.0 5.0 50 Nended ( 701 Duck 355 40 410 0.0% $15.53 $24.50 35.5% 900 0 30 The Year 3.0 50 100% Dot 366 78 440 436 0.0% $5.97 $15.45 $24.42 26.0% 600 0 3.0 3.0 30 Dune This Year 390 62 380 376 0.0% $8.97 $13.23 $22.20 22.7% 600 0 3.0 50 1st Shift ( 700 640 Price vs Unit Cost 3.0 NA 0 0 2nd Shift 0 0 0 8 0.0 05 19 NA D Overtime 0 0 0 00 05 0.0% VN 0 0 0 0 0 10 Max Invest ( A/P Lag Total Total 3,364 405 4,250 4,208 5,300 0 $32,694 30 Production Schedule Unt Sales Forecast Inventory On Hand Production Schedule Production After Ads Margins 2nd Shift Production Labor Cost/Unit Material Cost/Unit Total Unit Cost O Contribution Margin 1st Shift Capacity BuySell Capacity Automation Rating New Autom. Rating O Investment (5000) Workforce Complement Production vs Capacity Physical Plant Daze 189 1200 1,188 0.0% $7.85 $11.29 $19.13 31.7% 1,800 0 Last Year 4.0 4.0 10 200 Dell 4,357 39 1820 1,802 30.0% $7.46 $2.63 $15.09 28.1% 1,400 0 5.0 5.0 Needed $0 701 Dock 355 40 410 406 0.0% $8.97 $15.53 $24.50 35.5% 900 0 3.0 3.0 50 100 % This Year % Dot 366 78 440 436 0.0% $8.37 $15.45 $24.42 26.0% 600 0 3.0 3.0 This Year $0 Dune 700 390 29 380 376 0.0% $8.97 $13.23 $22,20 32.7% 009 0 3.0 3.0 $0 1st Shift 6:40 Price vs Unit Cost NA NA 0 0 D 0 ..... ..... 0 0.0 50 2nd Shift ( 63 0 Overtine 0 0 0 0.0 50 0.0% NA Max Invest A/P Lag 0 0 a 0 0 0 0 0 0 0.0 05 Total Total 3,364 400 4,250 4,200 $0 $32,694 30