Answered step by step
Verified Expert Solution
Link Copied!

Question

1 Approved Answer

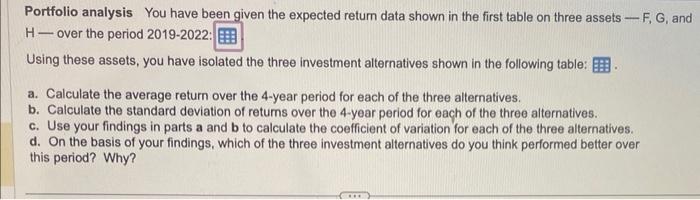
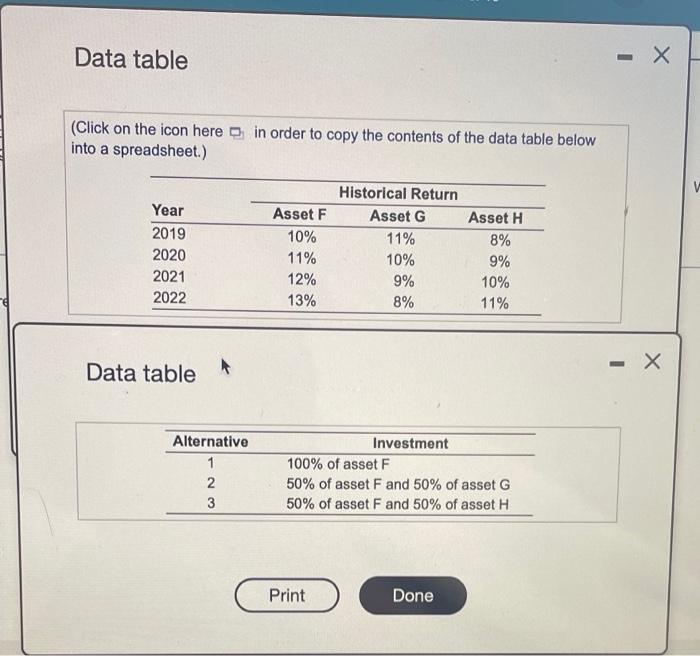
both attached data tables Portfolio analysis You have been given the expected return data shown in the first table on three assets - F,G, and

image text in transcribed
both attached data tables
image text in transcribed
Portfolio analysis You have been given the expected return data shown in the first table on three assets - F,G, and H- over the period 2019-2022: Using these assets, you have isolated the three investment alternatives shown in the following table: a. Calculate the average return over the 4-year period for each of the three alternatives. b. Calculate the standard deviation of retums over the 4 -year period for each of the three alternatives. c. Use your findings in parts a and b to calculate the coefficient of variation for each of the three alternatives. d. On the basis of your findings, which of the three investment alternatives do you think performed better over this period? Why? Data table (Click on the icon here n in order to copy the contents of the data table below into a spreadsheet.) Data table

Step by Step Solution

There are 3 Steps involved in it

Step: 1

blur-text-image

Get Instant Access to Expert-Tailored Solutions

See step-by-step solutions with expert insights and AI powered tools for academic success

Step: 2

blur-text-image

Step: 3

blur-text-image

Ace Your Homework with AI

Get the answers you need in no time with our AI-driven, step-by-step assistance

Get Started

Recommended Textbook for

R In Finance And Economics A Beginners Guide

Authors: Abhay Kumar Singh, David Edmund Allen

1st Edition

9813144467, 978-9813144460

More Books

Students also viewed these Finance questions

Question

Types of Interpersonal Relationships?

Answered: 1 week ago

Question

Self-Disclosure and Interpersonal Relationships?

Answered: 1 week ago