

Answered step by step
Verified Expert Solution
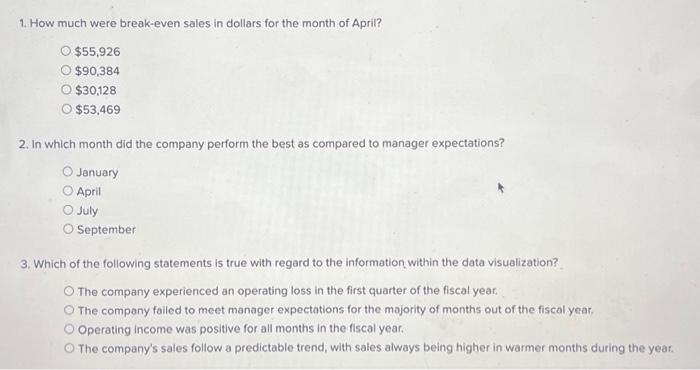
Question
1 Approved Answer
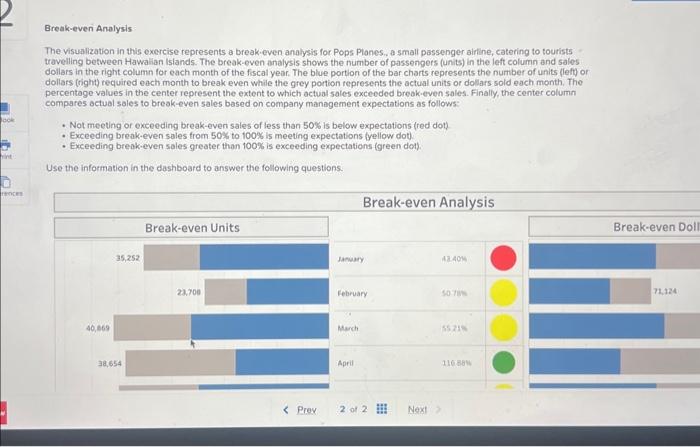
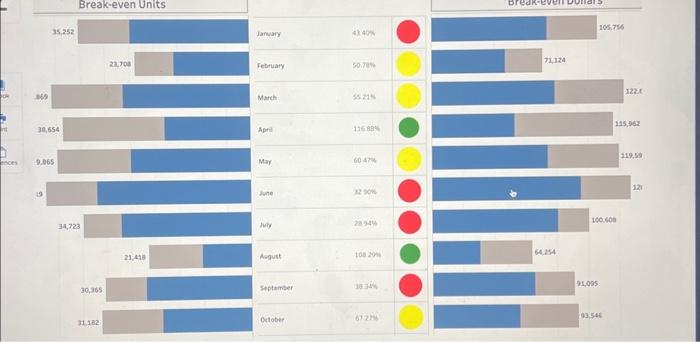
Break-even Analysis The visualization in this exercise represents a break.even analysis for Pops Planes. a small passenger airline, catering to tourists travelling between Hawalian islands.
Step by Step Solution
There are 3 Steps involved in it
Step: 1

Get Instant Access to Expert-Tailored Solutions
See step-by-step solutions with expert insights and AI powered tools for academic success
Step: 2

Step: 3
Ace Your Homework with AI
Get the answers you need in no time with our AI-driven, step-by-step assistance
Get Started
Are You Ready For An ISMS Audit Based On 27001
Authors: BSI British
1st Edition
0580829138, 978-0580829130