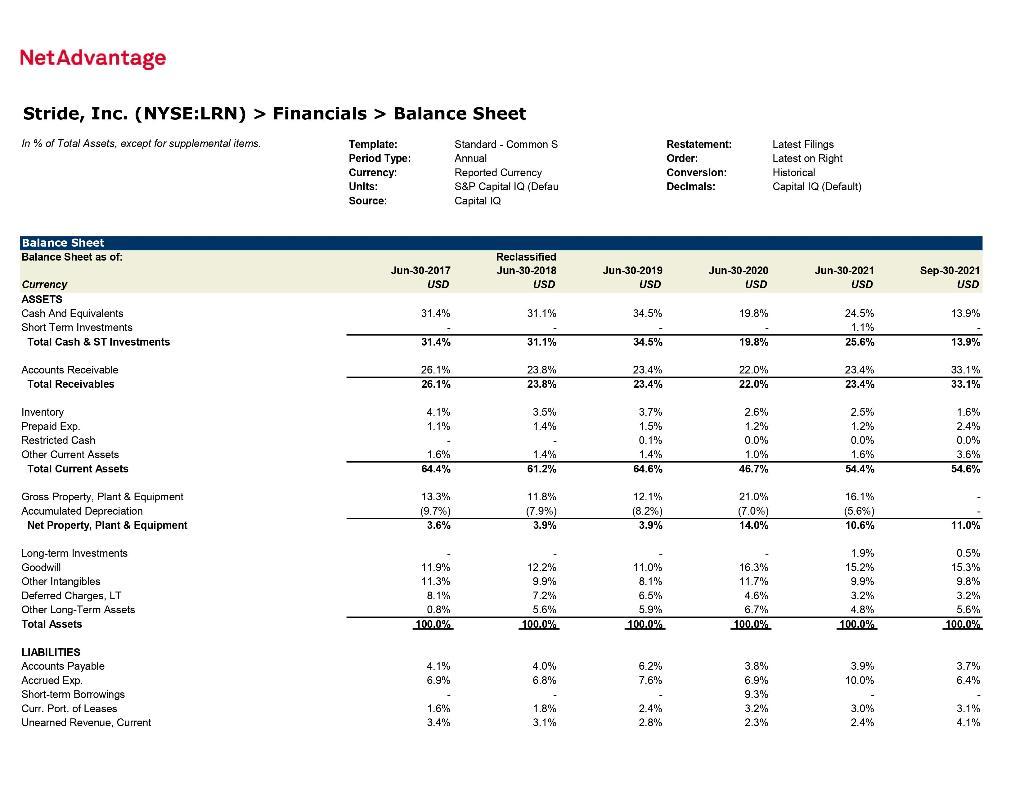
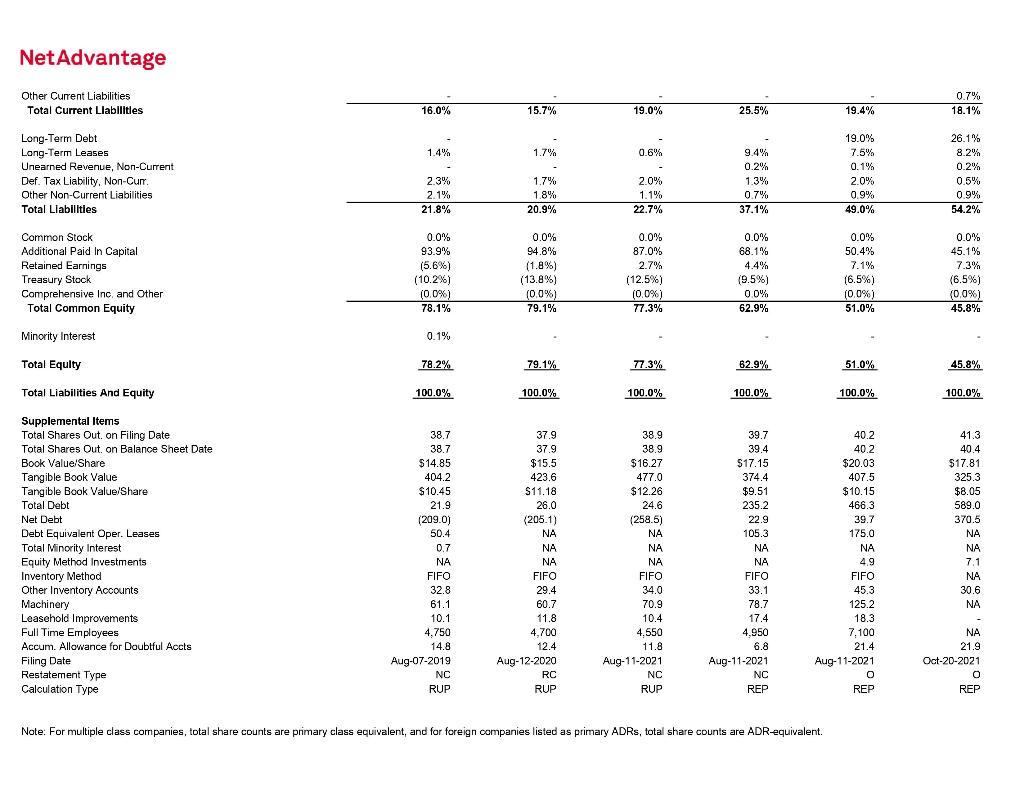
Briefly analyze the common-sized balance sheet generated from NetAdvantage (one paragraph). You should highlight the major components of each statement and note any significant and specific changes in the composition of the balance sheet and income statement over the past few years.

NetAdvantage Stride, Inc. (NYSE:LRN) > Financials > Balance Sheet In % of Total Assets, except for supplemental items. Template: Period Type: Currency: Units: Source: Standard - Common S | Annual Reported Currency S&P Capital IQ (Defau Capital IQ Restatement: Order: Conversion: Decimals: Latest Filings Latest on Right Historical Capital IQ (Default) Balance Sheet Balance Sheet as of: Jun-30-2017 USD Reclassified Jun-30-2018 USD Jun-30-2019 USD Jun-30-2020 USD Jun-30-2021 USD Sep-30-2021 USD Currency ASSETS Cash And Equivalents Short Term Investments Total Cash & ST Investments 31.4% 31.1% 34.5% 19.8% 13.9% 24.5% 1.1% 25,6% 31.4% 31.1% 34.5% 19.8% 13.9% 33 1 Accounts Receivable Total Receivables 26.1% 26.1% 23.8% 23.8% 23.4% 23.4% 22 0% 22.0% 23.4% 23.4% 33.1% 4.1% 1.1% 3.5% 1.4% Inventory Prepaid Exp. Restricted Cash Other Current Assets Total Current Assets 3.7% 1.5% 0.1% 1.4% 64.6% 2.6% 1.2% 0.0% 1.0% 46.7% 2.5% 1.2% 0.0% 1.6% 54.4% 1.6% 2.4% 0.0% 3.6% 54.6% 1.6% 64.4% 1.4% 61.2% Gross Property, Plant & Equipment Accumulated Depreciation Net Property, Plant & Equipment 13.3% (9.7%) 3.6% 11.8% (7.9%) 3.9% 12.1% (8.2%) 3.9% 21.0% (7.0%) 14.0% 16.1% (5.6%) 10.6% 11.0% Long-term Investments Goodwill Other Intangibles Deferred Charges, LT Other Long-Term Assets Total Assets 11.9% 11.3% 8.1% 0.8% 100.0% 12.2% 9.9% 7.2% 5.6% 100.0% 11.0% 8.1% 6.5% 5.9% 100.0% 16.3% 11.7% 4.6% 6.7% 100.0% 1.9% 15.2% 9.9% 3.2% 4.8% 100.0% 0.5% 15.3% 9.8% 3.2% 5.6% 100.0% 4.1% 6.9% 4.0% 6.8% 6.2% 7.6% 3.9% 10.0% 3.7% 6.4% LIABILITIES Accounts Payable Accrued Exp. Short-term Borrowings Curr. Port. of Leases Unearned Revenue, Current 3.8% 6.9% 9.3% 3.2% 2.3% 1.6% 3.4% 1.8% 3.1% 2.4% 2.8% 3.0% 2.4% 3.1% 4.1% NetAdvantage Other Current Liabilities Total Current Liabilitles 16.0% 0.7% 18.1% 15.7% 19.0% 25.5% 19.4% 1.4% 1.7% 0.6% Long-Term Debt Long-Term Leases Unearned Revenue, Non-Current Def. Tax Liability. Non-Curr. Other Non-Current Liabilities Total Liabilities 19.0% 7.5% 0.1% 2.0% 0.9% 49.0% 26.1% 8.2% 0.2% 0.5% 09% 54.2% 2.3% 2.1% 21.8% 9.4% 0.29 1.3% 0.7% 37.1% 1.7% 1.8% %. 20.9% 2.0% 1.1% 22.7% Common Stock Additional Paid In Capital Retained Earnings Treasury Stock Comprehensive Inc and Other Total Common Equity 0.0% 93.9% (5.6%) (10.2%) (0.0%) ) 78.1% 0.0% 94.8% (1.8%) (13.8%) (0.0%) 79.1% 0.0% 87.0% 2.7% (12.5%) (0.0%) 77.3% 0.0% % 68.1% 4.4% (9.5%) 00% 62.9% 0.0% 50.4% 7.1% (6.5%) (0.0%) 51.0% 0.0% 45.1% 7.3% (6.5%) (0,0%) 45.8% Minority Interest 0.1% Total Equity 78.2% 79.1% 77.3% 62.9% 51.0% 45.8% Total Liabilities And Equity 100.0% % 100.0% 100.0% 100.0% 100.0% 100.0% Supplemental Items Total Shares Outon Filing Date Total Shares Out on Balance Sheet Date Book Value/Share Tangible Book Value Tangible Book Value/Share Total Debt Net Debt Debt Equivalent Oper. Leases Total Minority Interest Equity Method Investments Inventory Method Other Inventory Accounts Machinery Leasehold Improvements Full Time Employees Accum. Allowance for Doubtful Accts Filing Date Restatement Type Calculation Type 38.7 38.7 $14.85 404.2 $10.45 21.9 (209.0) 50.4 0.7 NA FIFO 32.8 61.1 10.1 4.750 14.8 Aug-07-2019 NC RUP 37.9 37.9 $15.5 423.6 $11.18 26.0 (205.1) NA NA NA FIFO 29.4 60.7 11.8 4,700 12.4 Aug-12-2020 RC RUP 38.9 38.9 $16.27 477.0 $12.26 24.6 (258.5) NA NA NA FIFO 34.0 70.9 10.4 4.550 11.8 Aug-11-2021 NC RUP 39.7 39.4 $17.15 374.4 $9.51 235.2 22.9 105.3 NA NA FIFO 33.1 78.7 17.4 4.950 6.8 Aug-11-2021 NC REP 40.2 40.2 $20.03 407.5 $10.15 466.3 39.7 175.0 NA 4.9 FIFO 45.3 125.2 18.3 7.100 21.4 Aug-11-2021 o O REP 41.3 40.4 $17.81 325.3 $8.05 589.0 370.5 NA NA 7.1 NA 30.6 NA NA 21.9 Oct-20-2021 0 REP Note: For multiple class companies, total share counts are primary class equivalent, and for foreign companies listed as primary ADRs, total share counts are ADRequivalent. NetAdvantage Stride, Inc. (NYSE:LRN) > Financials > Balance Sheet In % of Total Assets, except for supplemental items. Template: Period Type: Currency: Units: Source: Standard - Common S | Annual Reported Currency S&P Capital IQ (Defau Capital IQ Restatement: Order: Conversion: Decimals: Latest Filings Latest on Right Historical Capital IQ (Default) Balance Sheet Balance Sheet as of: Jun-30-2017 USD Reclassified Jun-30-2018 USD Jun-30-2019 USD Jun-30-2020 USD Jun-30-2021 USD Sep-30-2021 USD Currency ASSETS Cash And Equivalents Short Term Investments Total Cash & ST Investments 31.4% 31.1% 34.5% 19.8% 13.9% 24.5% 1.1% 25,6% 31.4% 31.1% 34.5% 19.8% 13.9% 33 1 Accounts Receivable Total Receivables 26.1% 26.1% 23.8% 23.8% 23.4% 23.4% 22 0% 22.0% 23.4% 23.4% 33.1% 4.1% 1.1% 3.5% 1.4% Inventory Prepaid Exp. Restricted Cash Other Current Assets Total Current Assets 3.7% 1.5% 0.1% 1.4% 64.6% 2.6% 1.2% 0.0% 1.0% 46.7% 2.5% 1.2% 0.0% 1.6% 54.4% 1.6% 2.4% 0.0% 3.6% 54.6% 1.6% 64.4% 1.4% 61.2% Gross Property, Plant & Equipment Accumulated Depreciation Net Property, Plant & Equipment 13.3% (9.7%) 3.6% 11.8% (7.9%) 3.9% 12.1% (8.2%) 3.9% 21.0% (7.0%) 14.0% 16.1% (5.6%) 10.6% 11.0% Long-term Investments Goodwill Other Intangibles Deferred Charges, LT Other Long-Term Assets Total Assets 11.9% 11.3% 8.1% 0.8% 100.0% 12.2% 9.9% 7.2% 5.6% 100.0% 11.0% 8.1% 6.5% 5.9% 100.0% 16.3% 11.7% 4.6% 6.7% 100.0% 1.9% 15.2% 9.9% 3.2% 4.8% 100.0% 0.5% 15.3% 9.8% 3.2% 5.6% 100.0% 4.1% 6.9% 4.0% 6.8% 6.2% 7.6% 3.9% 10.0% 3.7% 6.4% LIABILITIES Accounts Payable Accrued Exp. Short-term Borrowings Curr. Port. of Leases Unearned Revenue, Current 3.8% 6.9% 9.3% 3.2% 2.3% 1.6% 3.4% 1.8% 3.1% 2.4% 2.8% 3.0% 2.4% 3.1% 4.1% NetAdvantage Other Current Liabilities Total Current Liabilitles 16.0% 0.7% 18.1% 15.7% 19.0% 25.5% 19.4% 1.4% 1.7% 0.6% Long-Term Debt Long-Term Leases Unearned Revenue, Non-Current Def. Tax Liability. Non-Curr. Other Non-Current Liabilities Total Liabilities 19.0% 7.5% 0.1% 2.0% 0.9% 49.0% 26.1% 8.2% 0.2% 0.5% 09% 54.2% 2.3% 2.1% 21.8% 9.4% 0.29 1.3% 0.7% 37.1% 1.7% 1.8% %. 20.9% 2.0% 1.1% 22.7% Common Stock Additional Paid In Capital Retained Earnings Treasury Stock Comprehensive Inc and Other Total Common Equity 0.0% 93.9% (5.6%) (10.2%) (0.0%) ) 78.1% 0.0% 94.8% (1.8%) (13.8%) (0.0%) 79.1% 0.0% 87.0% 2.7% (12.5%) (0.0%) 77.3% 0.0% % 68.1% 4.4% (9.5%) 00% 62.9% 0.0% 50.4% 7.1% (6.5%) (0.0%) 51.0% 0.0% 45.1% 7.3% (6.5%) (0,0%) 45.8% Minority Interest 0.1% Total Equity 78.2% 79.1% 77.3% 62.9% 51.0% 45.8% Total Liabilities And Equity 100.0% % 100.0% 100.0% 100.0% 100.0% 100.0% Supplemental Items Total Shares Outon Filing Date Total Shares Out on Balance Sheet Date Book Value/Share Tangible Book Value Tangible Book Value/Share Total Debt Net Debt Debt Equivalent Oper. Leases Total Minority Interest Equity Method Investments Inventory Method Other Inventory Accounts Machinery Leasehold Improvements Full Time Employees Accum. Allowance for Doubtful Accts Filing Date Restatement Type Calculation Type 38.7 38.7 $14.85 404.2 $10.45 21.9 (209.0) 50.4 0.7 NA FIFO 32.8 61.1 10.1 4.750 14.8 Aug-07-2019 NC RUP 37.9 37.9 $15.5 423.6 $11.18 26.0 (205.1) NA NA NA FIFO 29.4 60.7 11.8 4,700 12.4 Aug-12-2020 RC RUP 38.9 38.9 $16.27 477.0 $12.26 24.6 (258.5) NA NA NA FIFO 34.0 70.9 10.4 4.550 11.8 Aug-11-2021 NC RUP 39.7 39.4 $17.15 374.4 $9.51 235.2 22.9 105.3 NA NA FIFO 33.1 78.7 17.4 4.950 6.8 Aug-11-2021 NC REP 40.2 40.2 $20.03 407.5 $10.15 466.3 39.7 175.0 NA 4.9 FIFO 45.3 125.2 18.3 7.100 21.4 Aug-11-2021 o O REP 41.3 40.4 $17.81 325.3 $8.05 589.0 370.5 NA NA 7.1 NA 30.6 NA NA 21.9 Oct-20-2021 0 REP Note: For multiple class companies, total share counts are primary class equivalent, and for foreign companies listed as primary ADRs, total share counts are ADRequivalent


