Answered step by step
Verified Expert Solution
Question
1 Approved Answer
bshop tort Relative Frequency Name: Directions: Graph the following linear inequalities. 1. A survey of 3,000 who bought a new car showed that 900
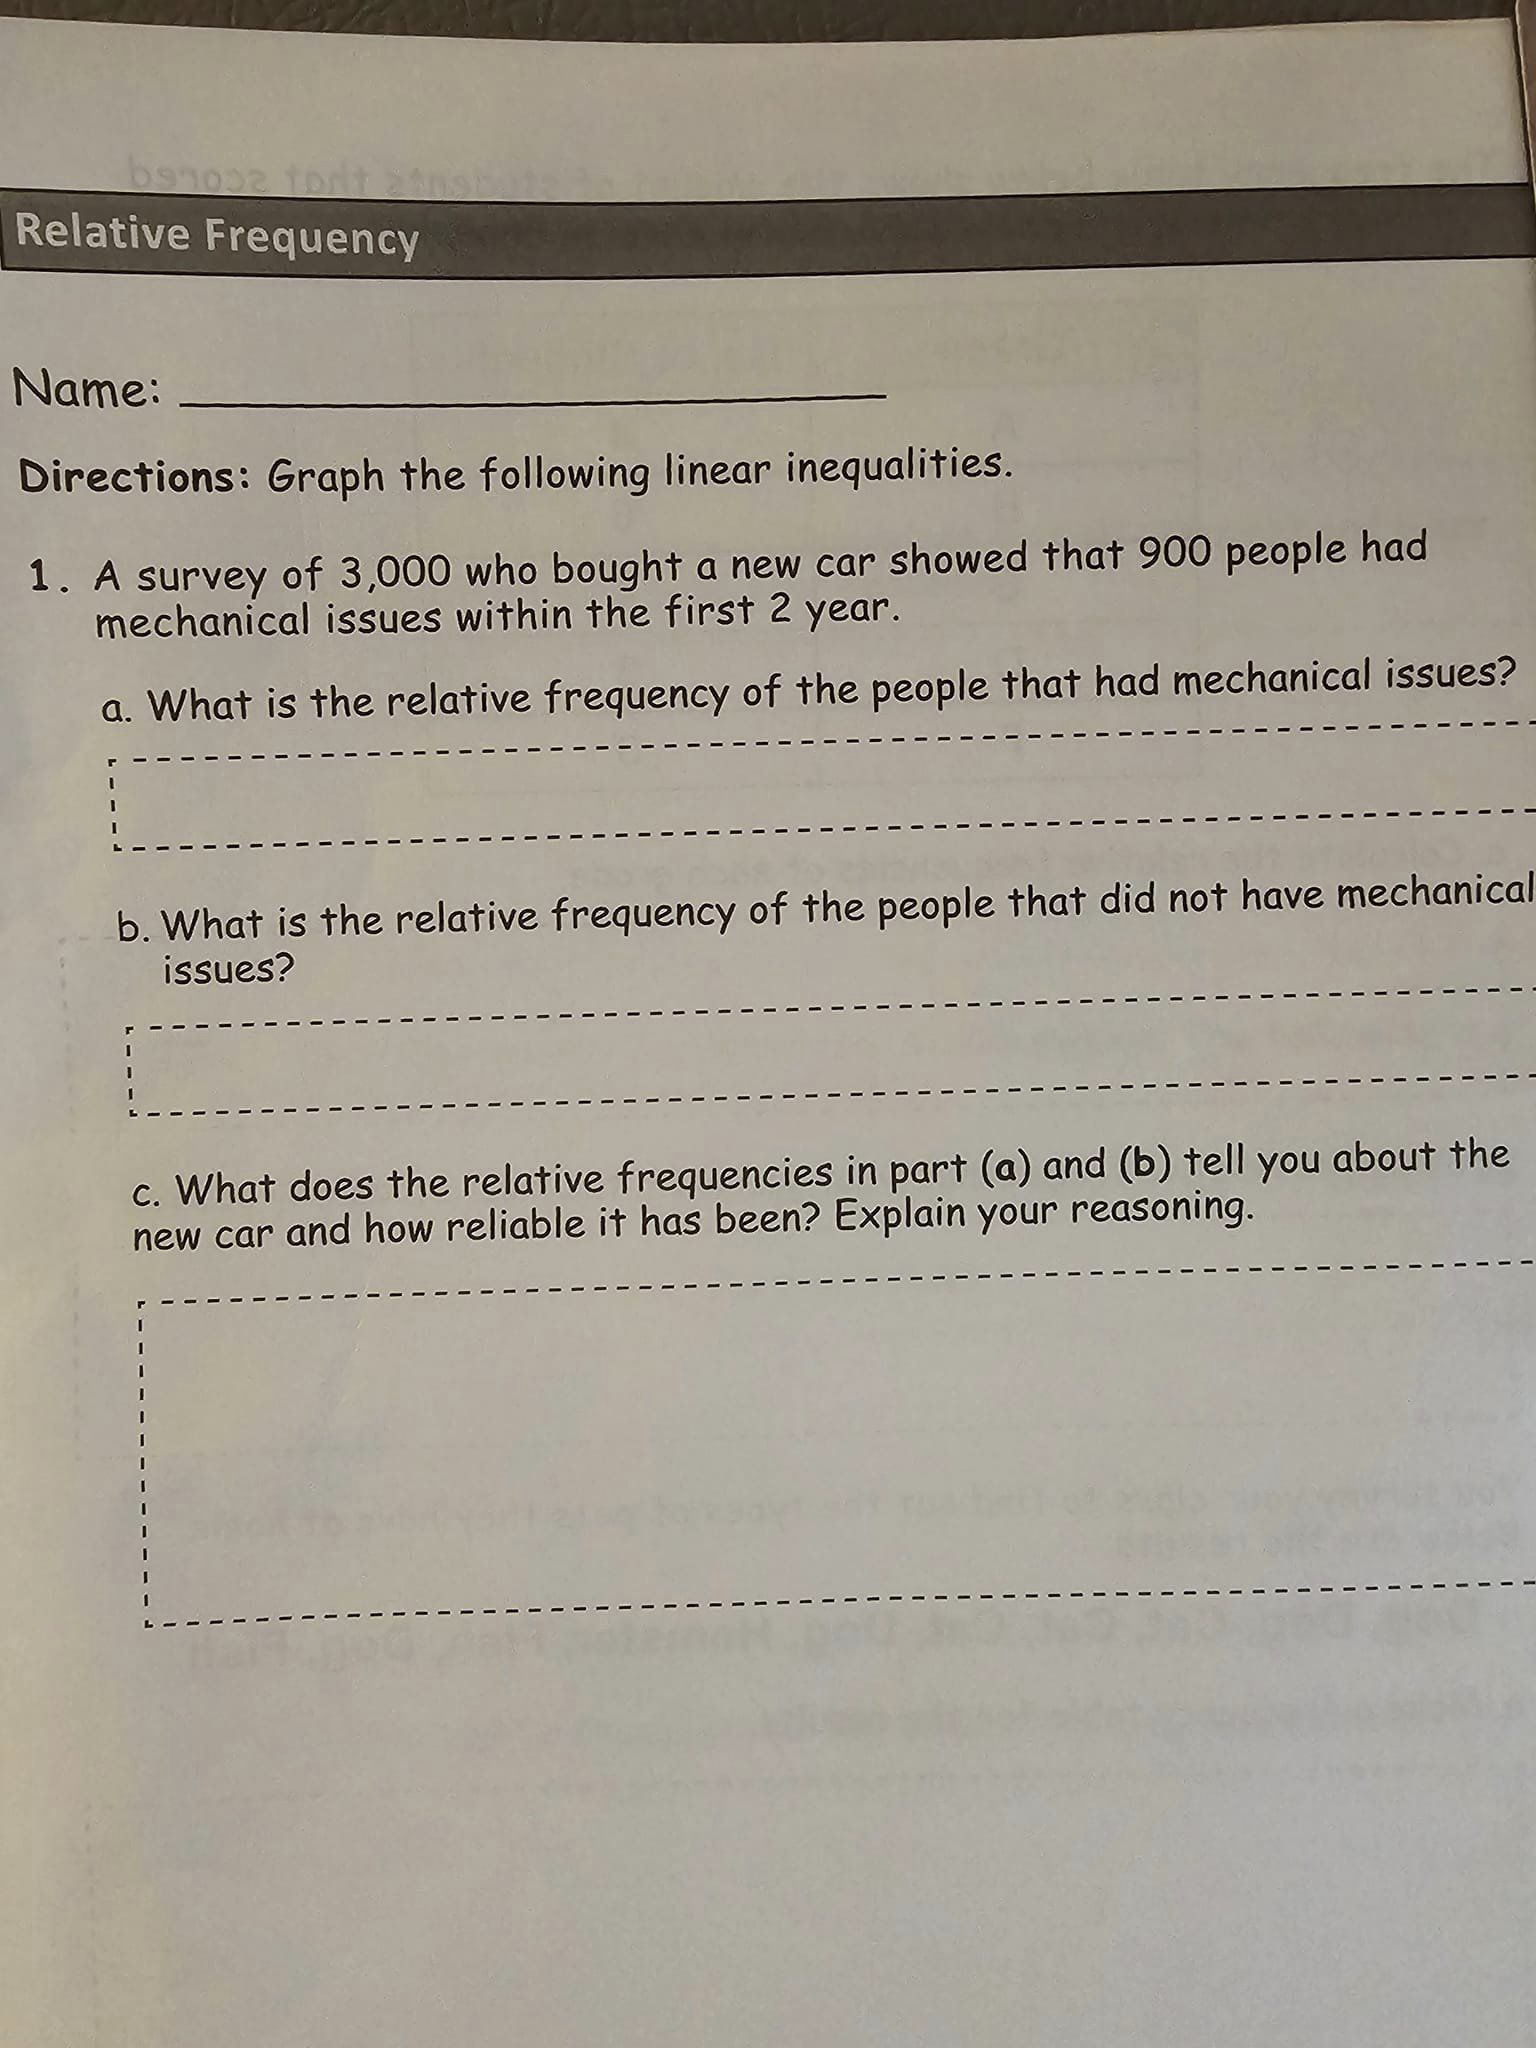
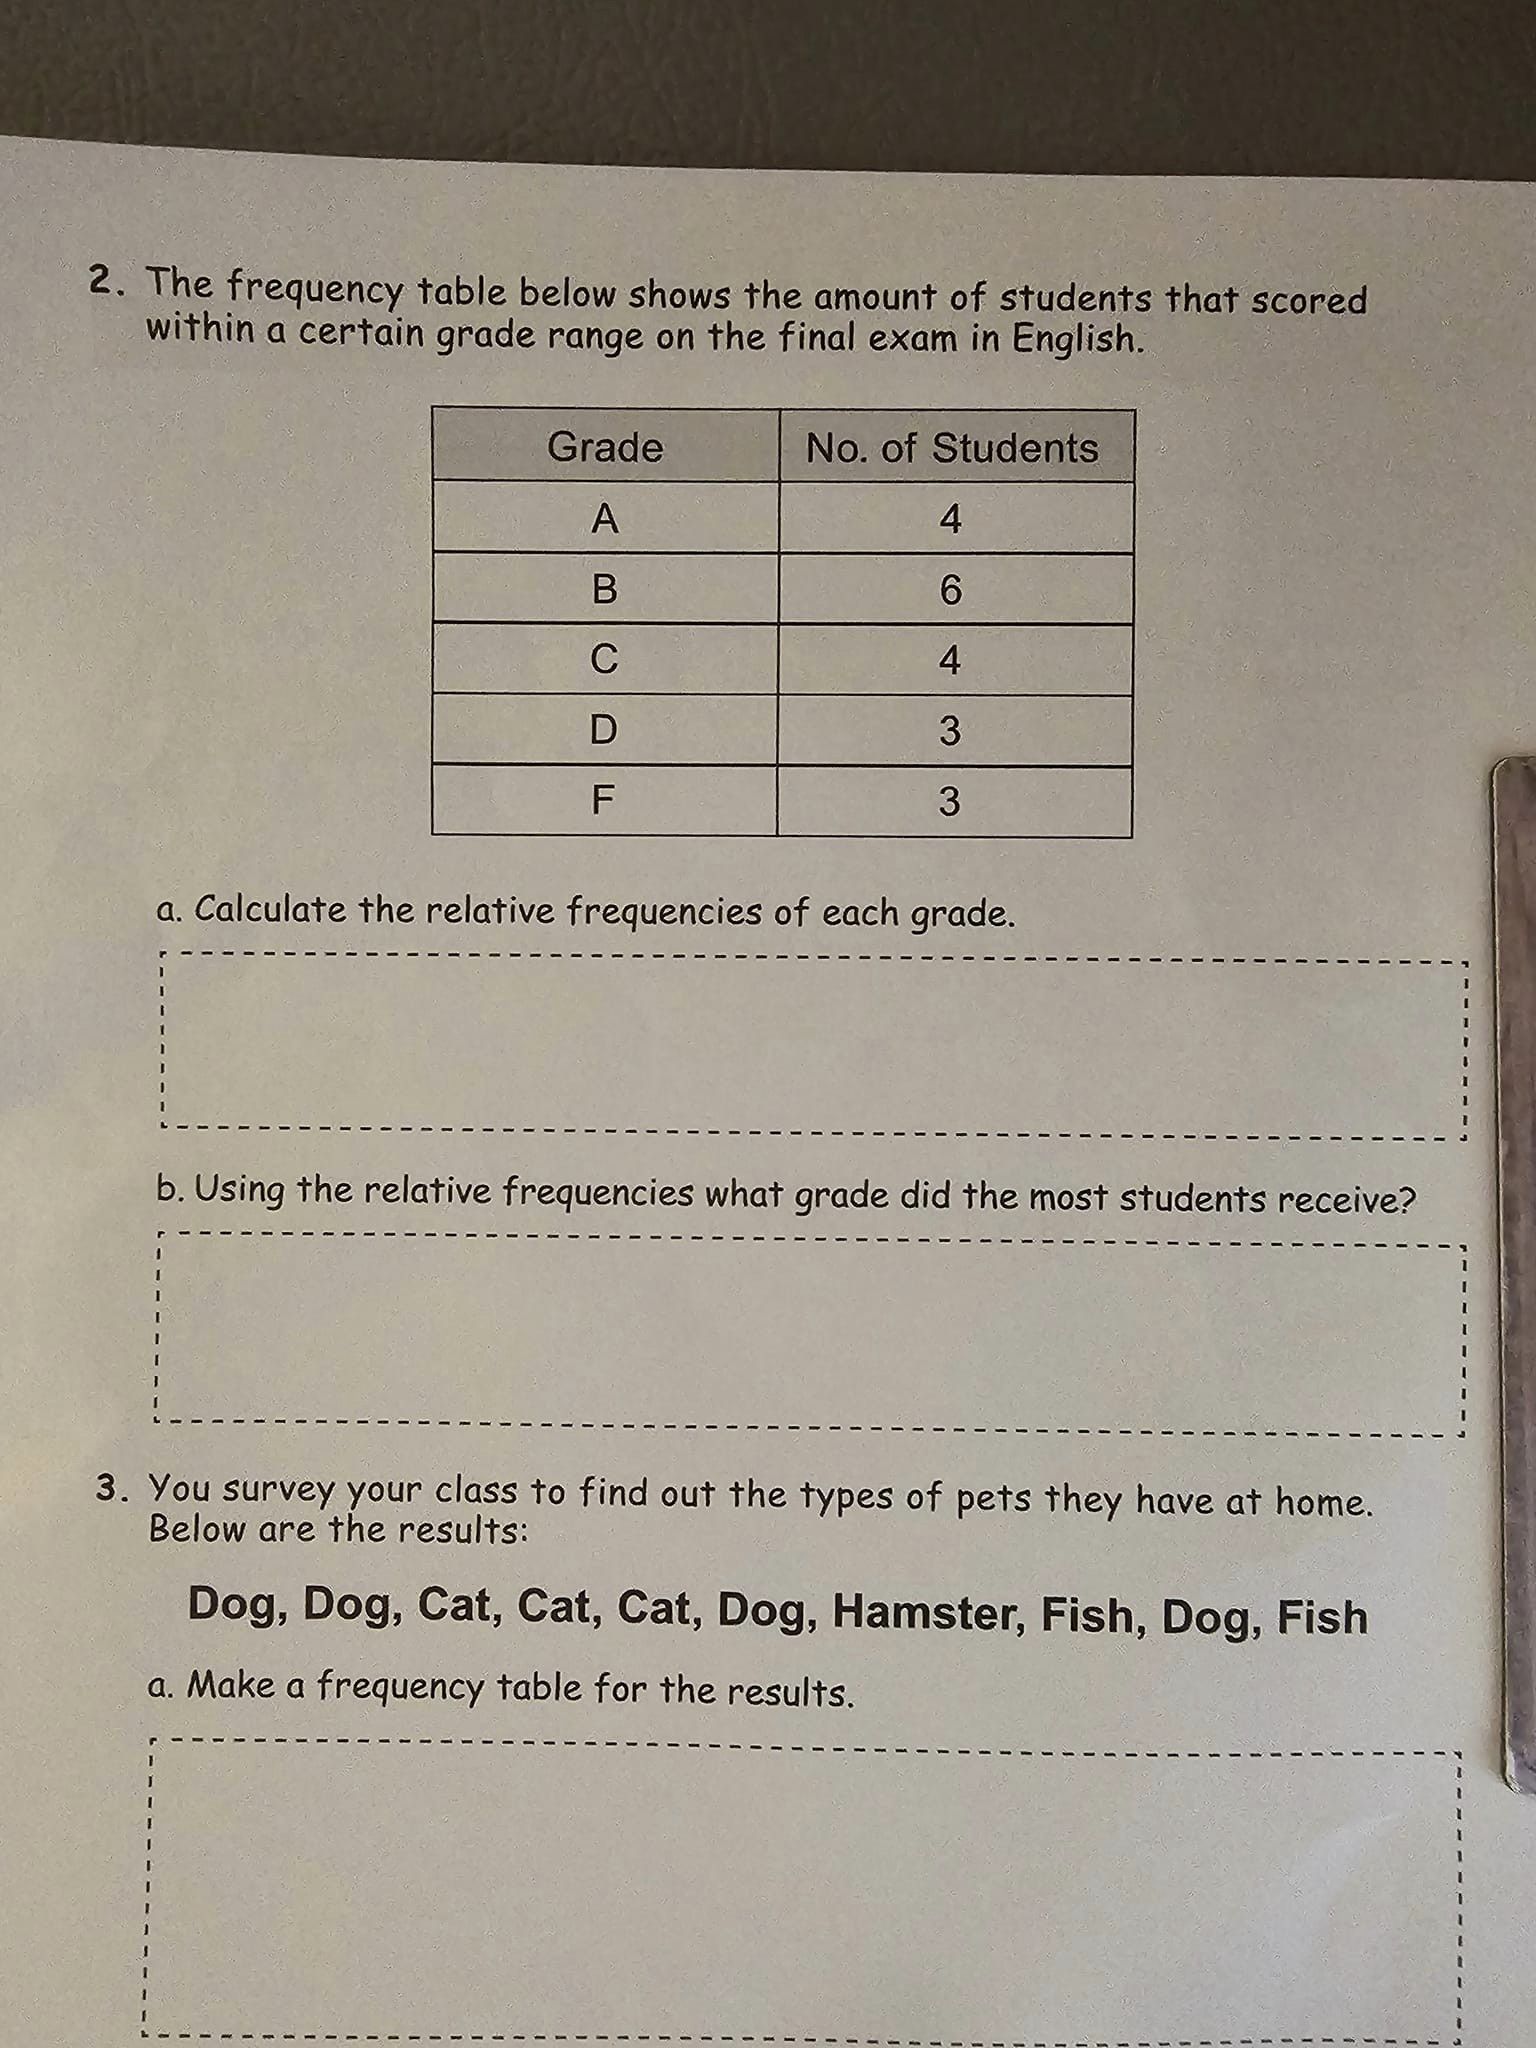
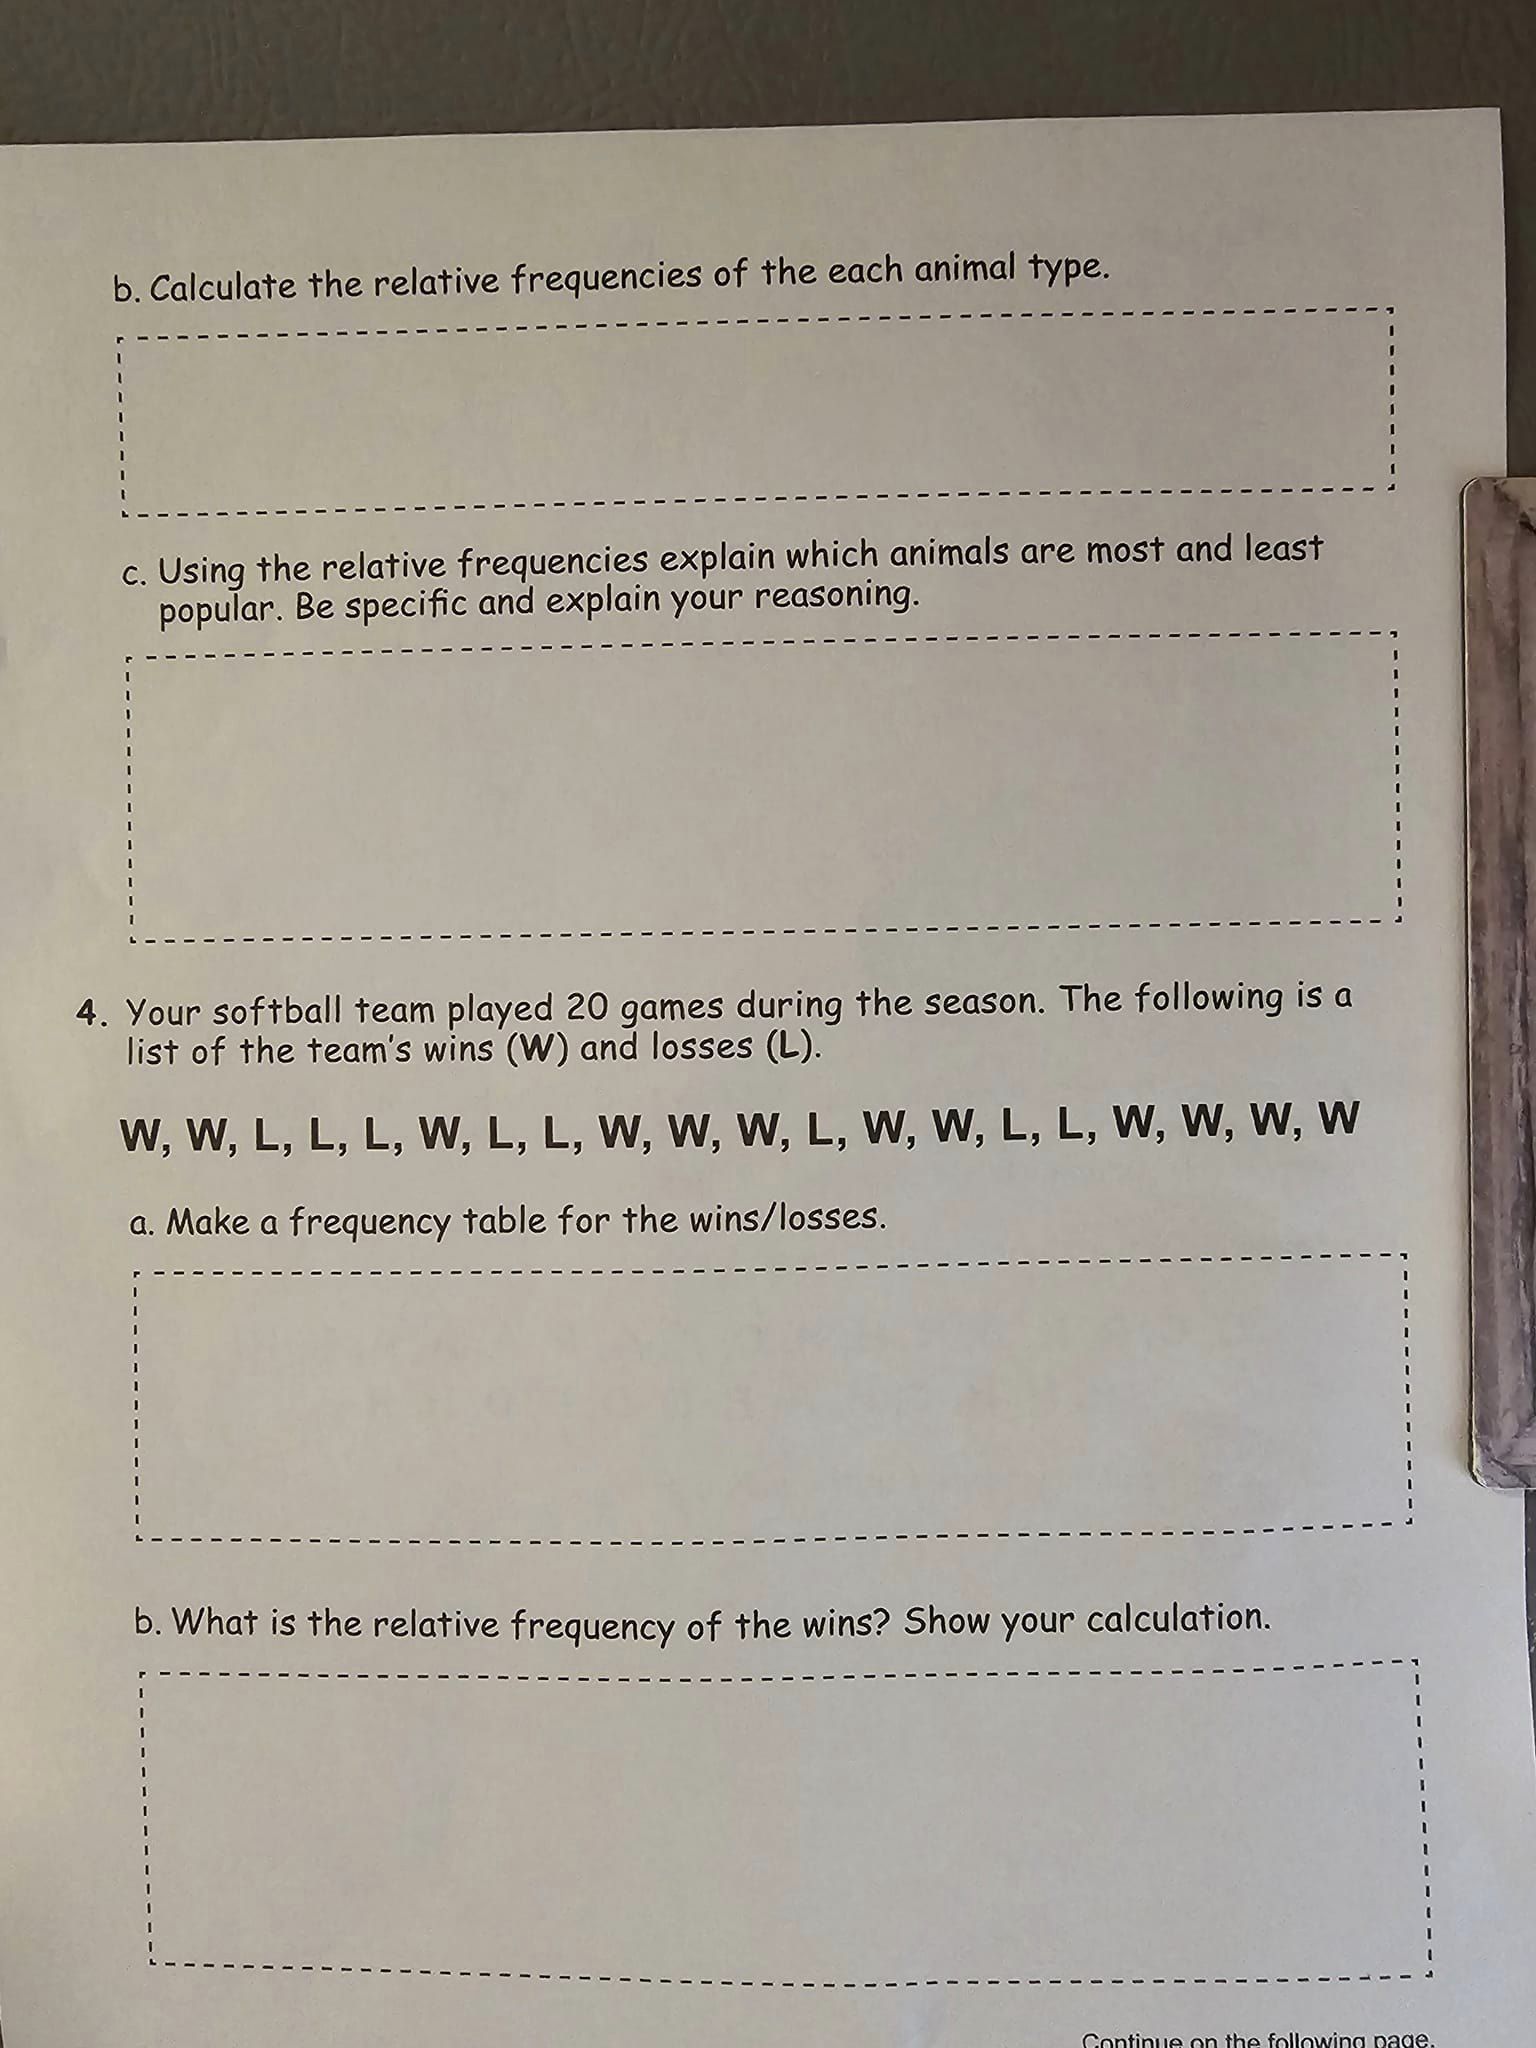
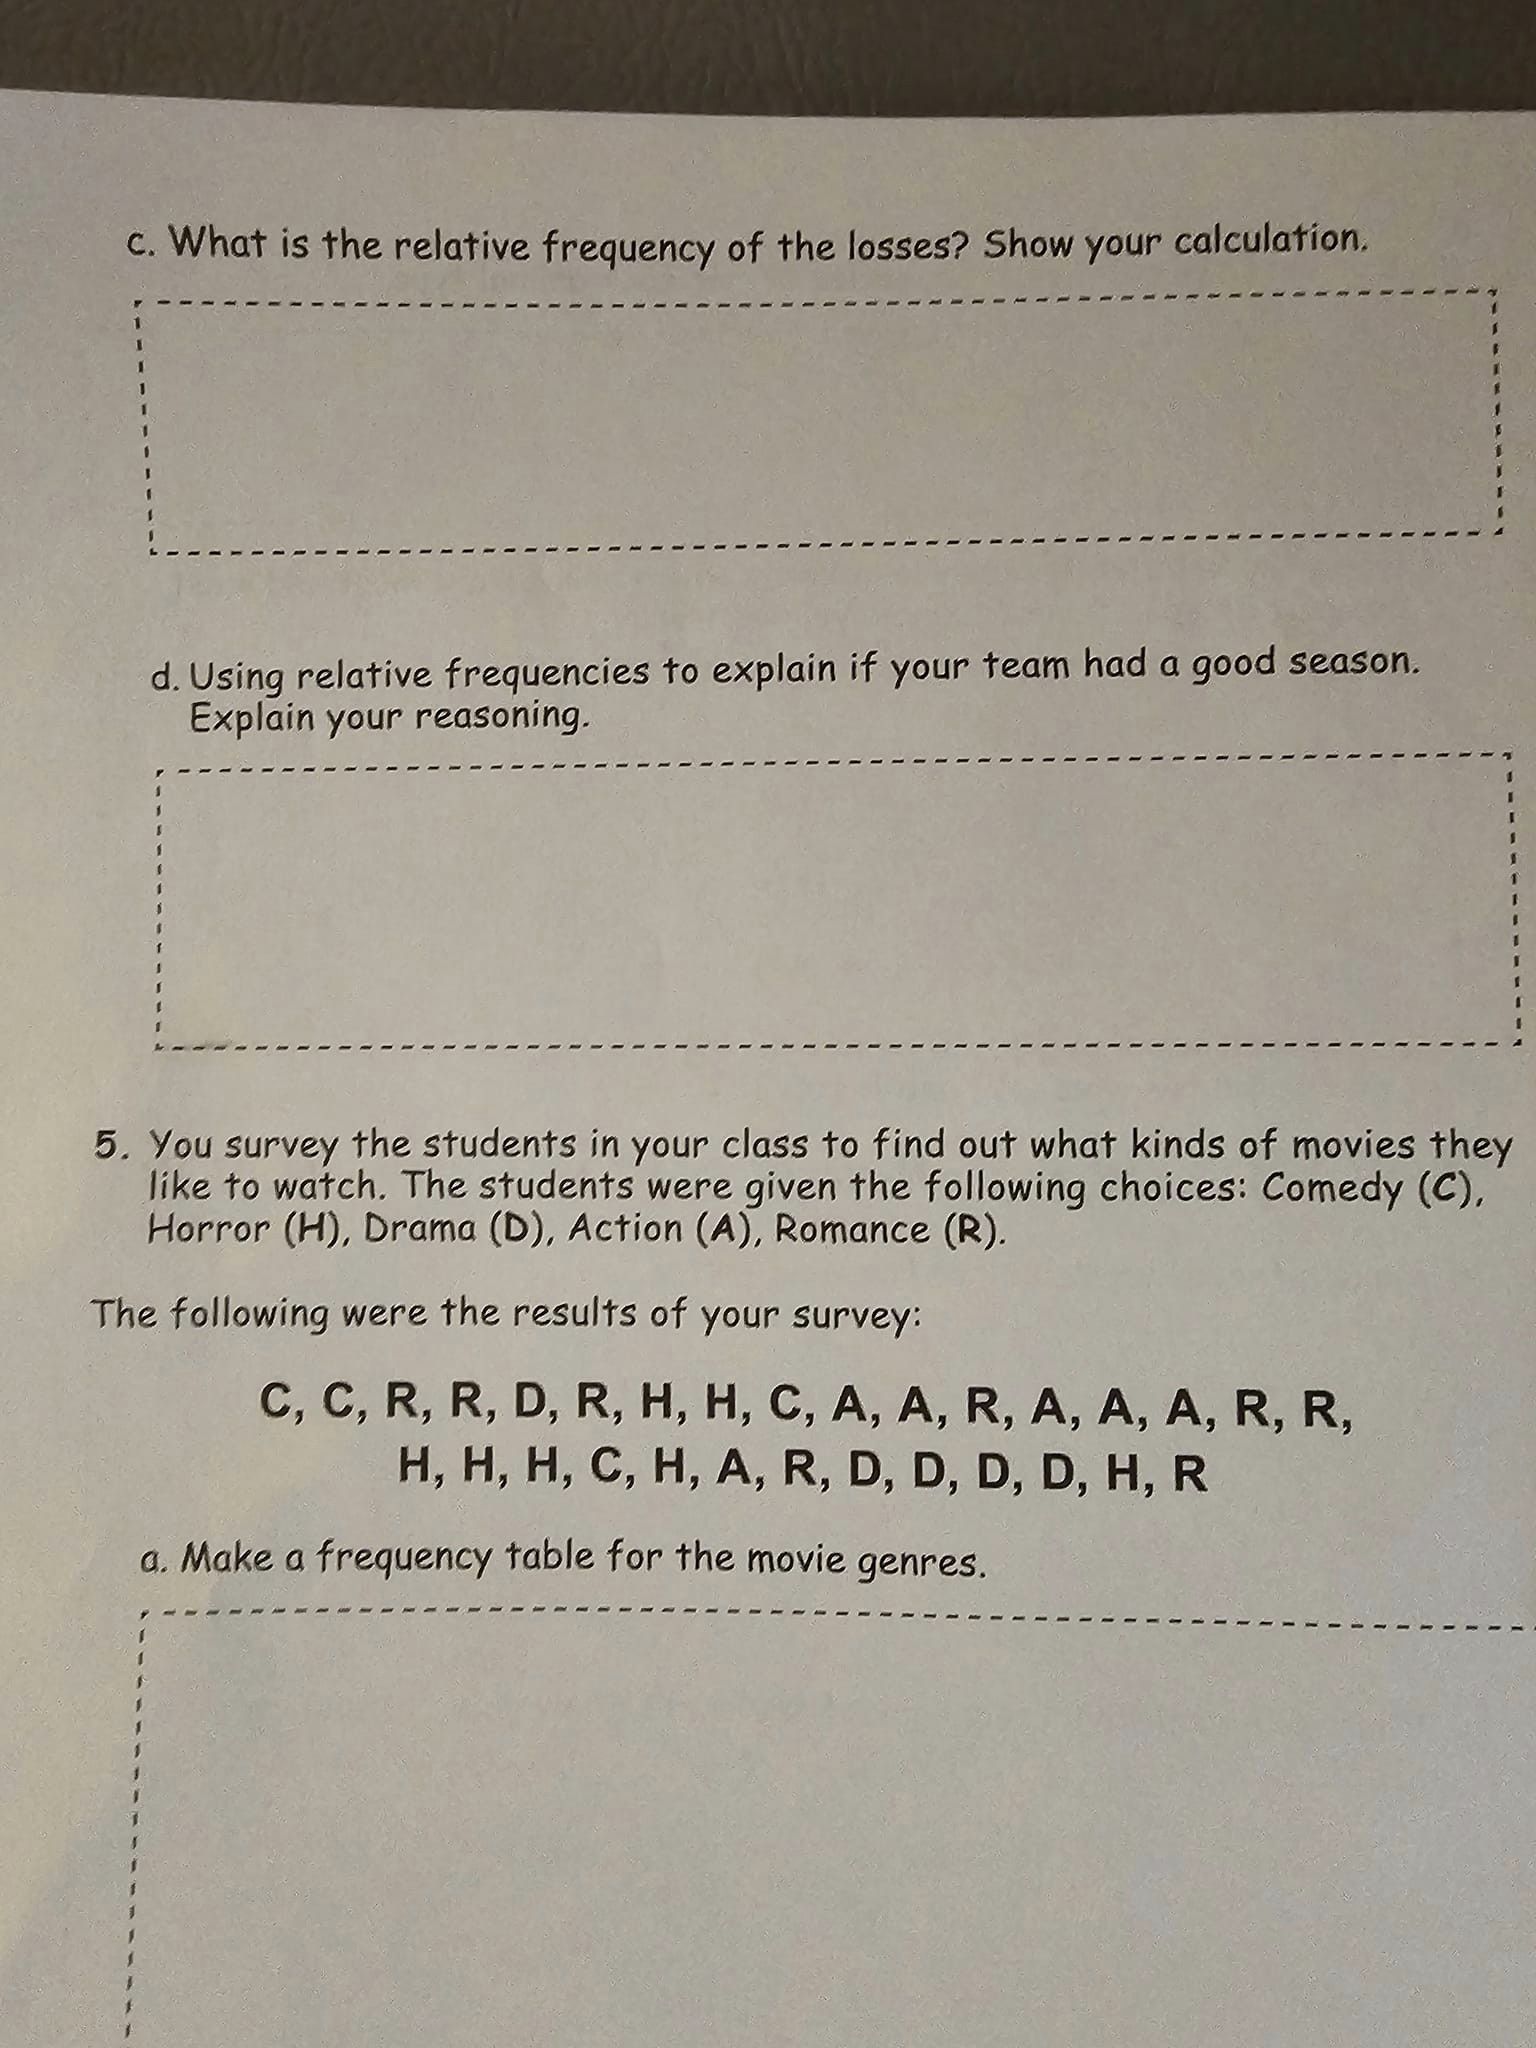
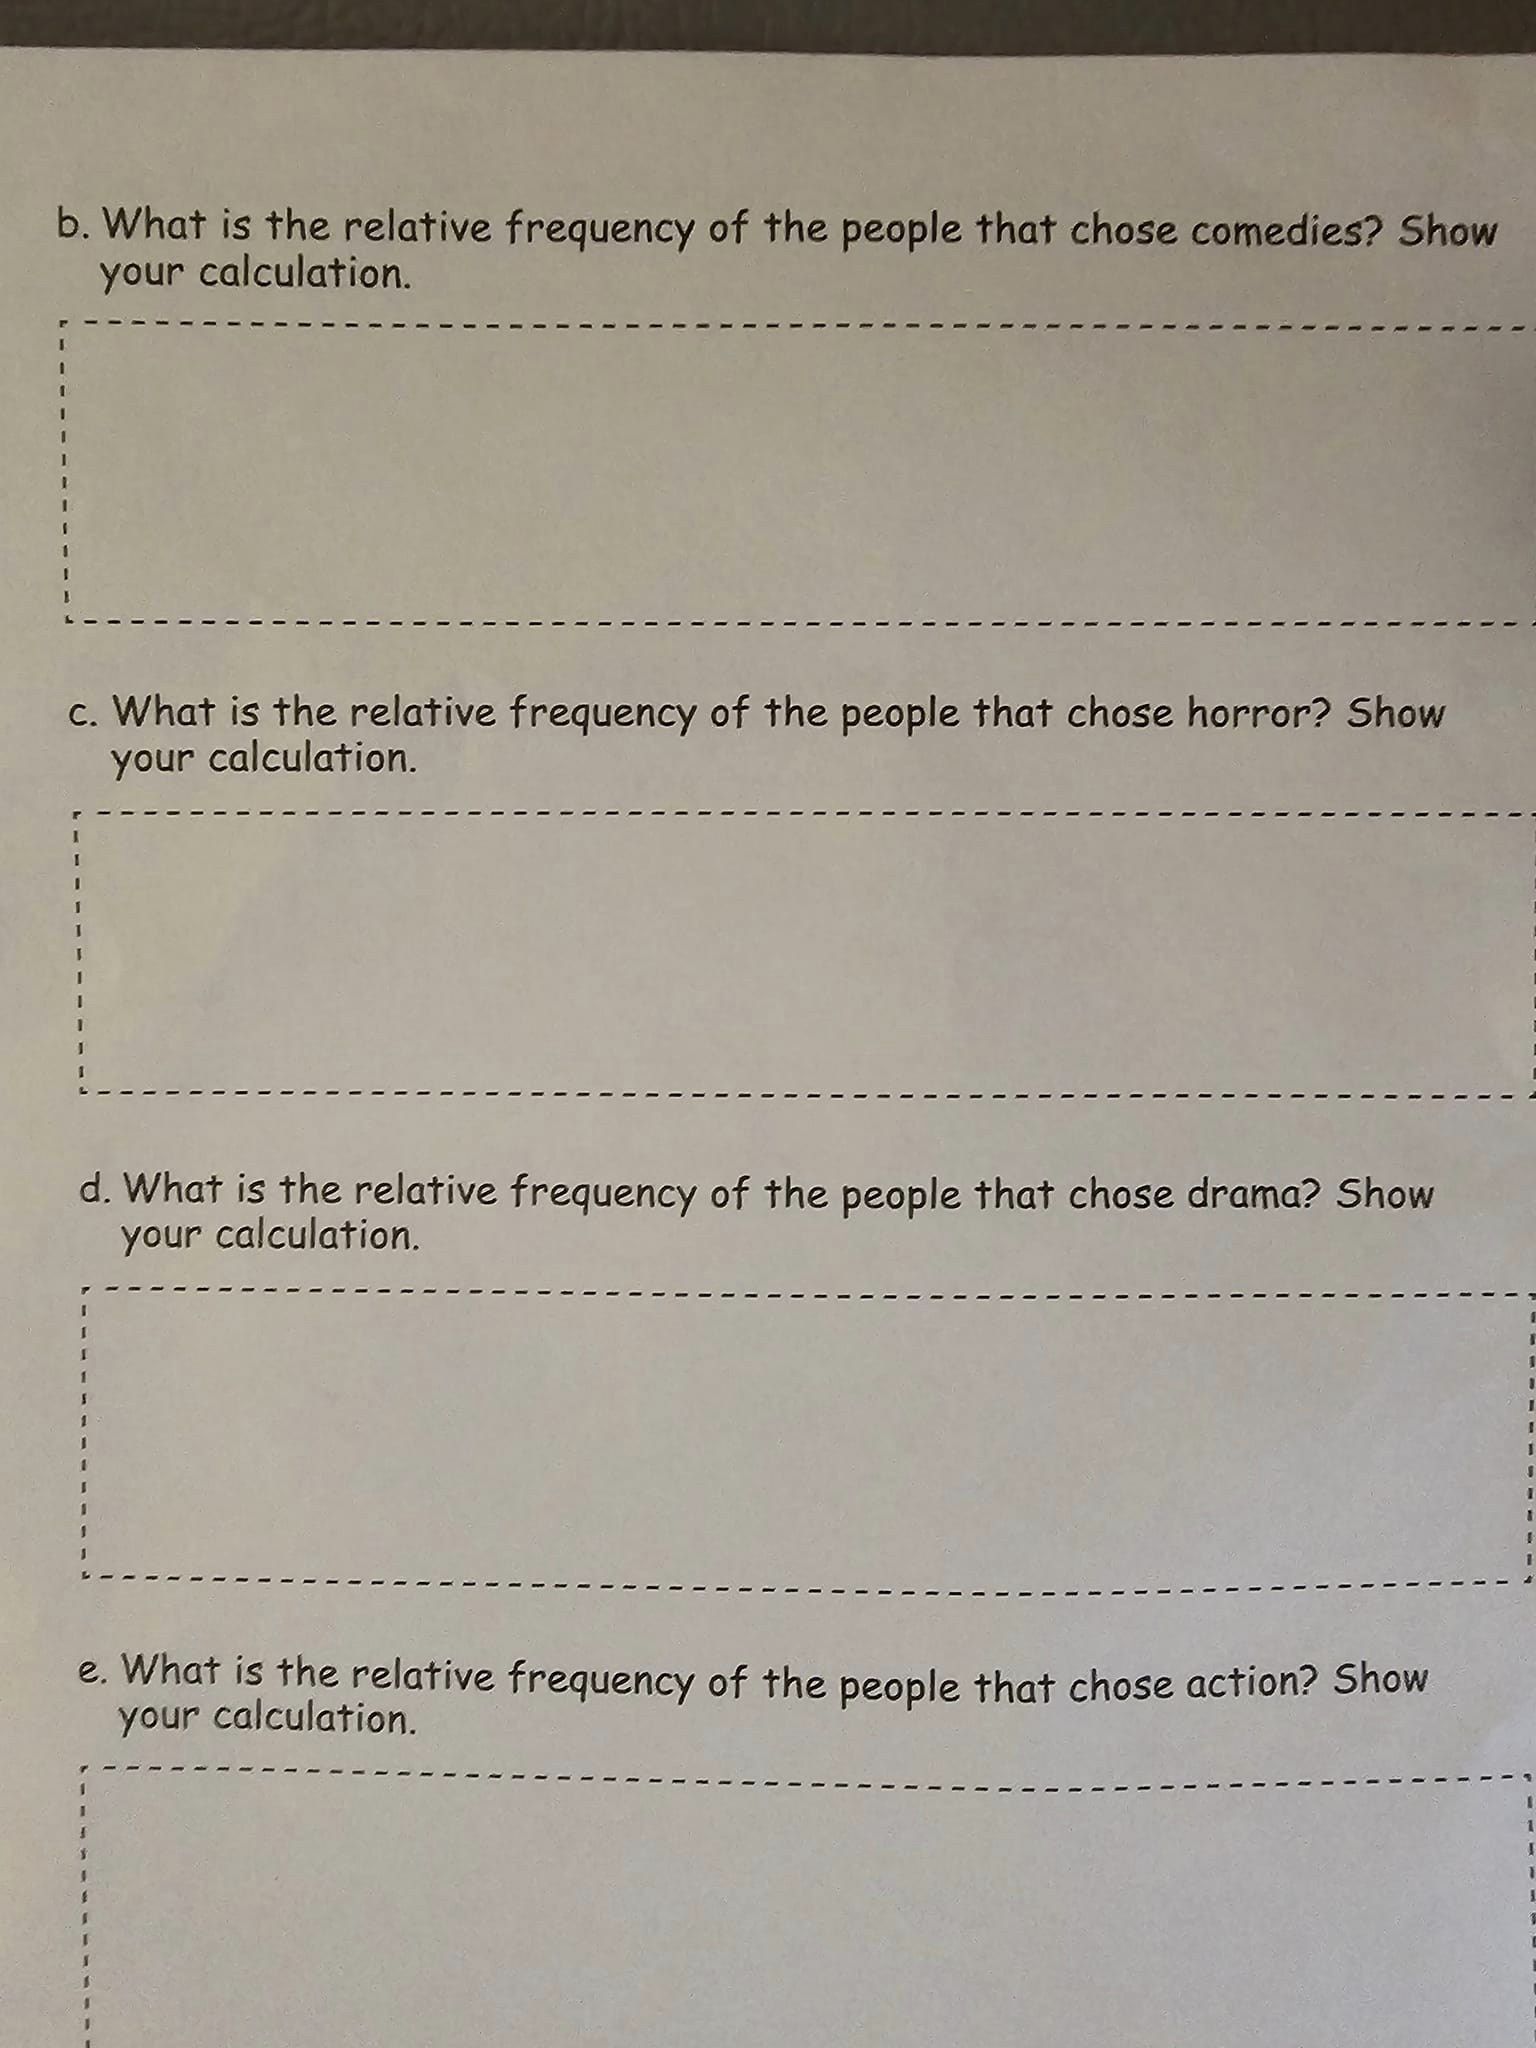
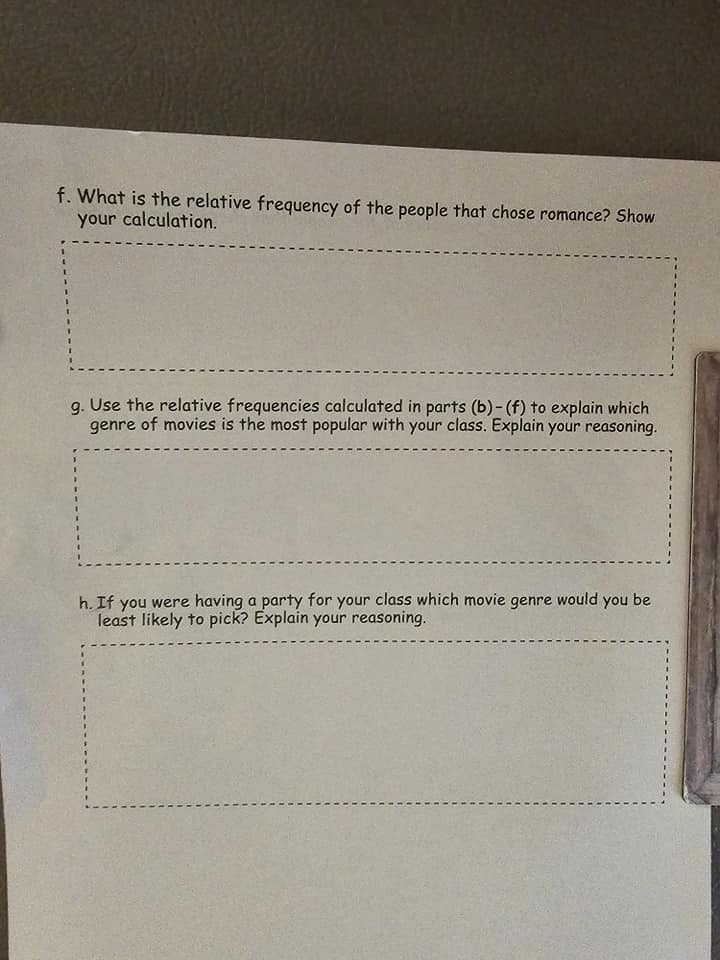
bshop tort Relative Frequency Name: Directions: Graph the following linear inequalities. 1. A survey of 3,000 who bought a new car showed that 900 people had mechanical issues within the first 2 year. a. What is the relative frequency of the people that had mechanical issues? b. What is the relative frequency of the people that did not have mechanical issues? c. What does the relative frequencies in part (a) and (b) tell you about the new car and how reliable it has been? Explain your reasoning. 1 I 2. The frequency table below shows the amount of students that scored within a certain grade range on the final exam in English. Grade A No. of Students 4 B 6 C 4 D 3 F 3 a. Calculate the relative frequencies of each grade. b. Using the relative frequencies what grade did the most students receive? 3. You survey your class to find out the types of pets they have at home. Below are the results: Dog, Dog, Cat, Cat, Cat, Dog, Hamster, Fish, Dog, Fish a. Make a frequency table for the results. b. Calculate the relative frequencies of the each animal type. c. Using the relative frequencies explain which animals are most and least popular. Be specific and explain your reasoning. 4. Your softball team played 20 games during the season. The following is a list of the team's wins (W) and losses (L). W, W, L, L, L, W, L, L, W, W, W, L, W, W, L, L, W, W, W, W a. Make a frequency table for the wins/losses. b. What is the relative frequency of the wins? Show your calculation. . I c. What is the relative frequency of the losses? Show your calculation. d. Using relative frequencies to explain if your team had a good season. Explain your reasoning. 5. You survey the students in your class to find out what kinds of movies they like to watch. The students were given the following choices: Comedy (C), Horror (H), Drama (D), Action (A), Romance (R). The following were the results of your survey: C, C, R, R, D, R, H, H, C, A, A, R, A, A, A, R, R, H, H, H, C, H, A, R, D, D, D, D, H, R a. Make a frequency table for the movie genres. b. What is the relative frequency of the people that chose comedies? Show your calculation. c. What is the relative frequency of the people that chose horror? Show your calculation. d. What is the relative frequency of the people that chose drama? Show your calculation. I 1 1 I 1 1 e. What is the relative frequency of the people that chose action? Show your calculation. 1 1 1 I I 1 S I 1 1 I 1 L 1 f. What is the relative frequency of the people that chose romance? Show your calculation. g. Use the relative frequencies calculated in parts (b)-(f) to explain which genre of movies is the most popular with your class. Explain your reasoning. h. If you were having a party for your class which movie genre would you be least likely to pick? Explain your reasoning.
Step by Step Solution
There are 3 Steps involved in it
Step: 1
Answer for Question 1 a Relative frequency of people who had mechanical issues This can be arrived at by dividing the number of favourable outcomes divided by total number of trialstotal sample size N...
Get Instant Access to Expert-Tailored Solutions
See step-by-step solutions with expert insights and AI powered tools for academic success
Step: 2

Step: 3

Ace Your Homework with AI
Get the answers you need in no time with our AI-driven, step-by-step assistance
Get Started


