Question
Building on Homework #8: 1. Download the TRUCKEE #2 SNOTEL daily precipitation for the 2017 Water Year. You can find the data you will need

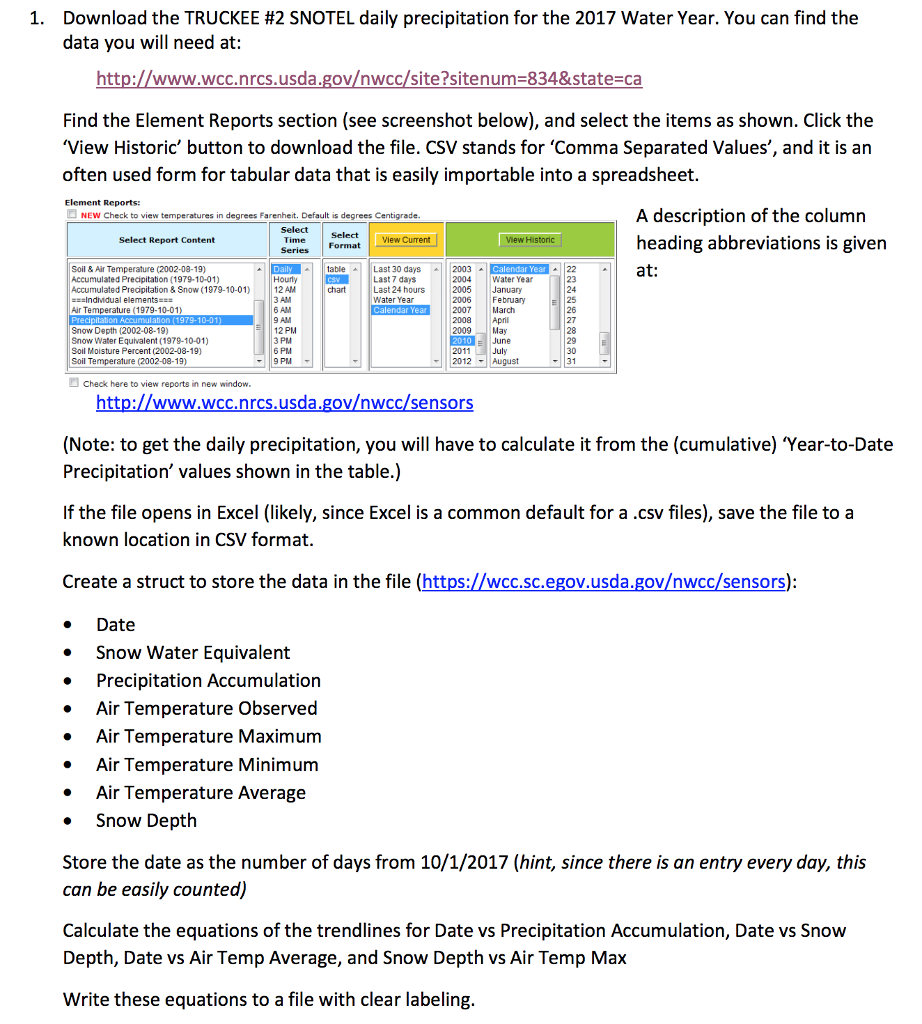
Building on Homework #8: 1. Download the TRUCKEE #2 SNOTEL daily precipitation for the 2017 Water Year. You can find the data you will need at: http://www.wcc.nrcs.usda.govwcc/site?sitenum=834&state=ca Find the Element Reports section (see screenshot below), and select the items as shown. Click the View Historic button to download the file. CSV stands for Comma Separated Values, and it is an often used form for tabular data that is easily importable into a spreadsheet. A description of the column heading abbreviations is given at: http://www.wcc.nrcs.usda.govwcc/sensors (Note: to get the daily precipitation, you will have to calculate it from the (cumulative) Year-to-Date Precipitation values shown in the table.) If the file opens in Excel (likely, since Excel is a common default for a .csv files), save the file to a known location in CSV format. Create a struct to store the data in the file (https://wcc.sc.egov.usda.govwcc/sensors): Date Snow Water Equivalent Precipitation Accumulation Air Temperature Observed Air Temperature Maximum Air Temperature Minimum Air Temperature Average Snow Depth Store the date as the number of days from 10/1/2017 (hint, since there is an entry every day, this can be easily counted) Calculate the equations of the trendlines for Date vs Precipitation Accumulation, Date vs Snow Depth, Date vs Air Temp Average, and Snow Depth vs Air Temp Max Write these equations to a file with clear labeling.
1. Download the TRUCKEE #2 SNOTEL daily precipitation for the 2017 Water Year. You can find the data you will need at: http://www.wcc.nrcs.usda.govwcc/site?sitenum-834&state-ca Find the Element Reports section (see screenshot below), and select the items as shown. Click the 'View Historic' button to download the file. CSV stands for 'Comma Separated Values', and it is an often used form for tabular data that is easily importable into a spreadsheet. Element Reports: A description of the column heading abbreviations is given NEW Check to view temperatures in degrees Farenheit. Default is degrees Centigrade. Select Report Content Series FormatView Current tableLast 30 days 2003 2004Water Year 2005January 2006 February 2007March 2008April 2009May 2001 June 2011 July 2012 August Soil & Air Temperature (2002-08-19) Accumulated Precipitation (1979-10-01) Accumulated Precipitation& Snow (1979-10-01) HourlyLast 7 days 12 AM 3 AM 6 AM 9 AM 12 PM 3 PM 6 PM 9 PM 23 24 25 26 27 28 29 30 - 31 chart Last 24 hours Water Year Air Temperature (1979-10-01) Snow Depth (2002-08-19) Snow Water Equivalent (1979-10-01) Soil Moisture Percent (2002-08-19) Soil Temperature (2002-08-19 Check here to view reports in new window. http://www.wcc.nrcs.usda.govwcc/sensors (Note: to get the daily precipitation, you will have to calculate it from the (cumulative) 'Year-to-Date Precipitation' values shown in the table.) If the file opens in Excel (likely, since Excel is a common default for a .csv files), save the file to a known location in CSV format. Create a struct to store the data in the file (https://wcc.sc.egov.usda.govwcc/sensors): Date Snow Water Equivalent Precipitation Accumulation . Air Temperature Observed . Air Temperature Maximum Air Temperature Minimum Air Temperature Average . Snow Depth Store the date as the number of days from 10/1/2017 (hint, since there is an entry every day, this can be easily counted) Calculate the equations of the trendlines for Date vs Precipitation Accumulation, Date vs Snow Depth, Date vs Air Temp Average, and Snow Depth vs Air Temp Max Write these equations to a file with clear labeling 1. Download the TRUCKEE #2 SNOTEL daily precipitation for the 2017 Water Year. You can find the data you will need at: http://www.wcc.nrcs.usda.govwcc/site?sitenum-834&state-ca Find the Element Reports section (see screenshot below), and select the items as shown. Click the 'View Historic' button to download the file. CSV stands for 'Comma Separated Values', and it is an often used form for tabular data that is easily importable into a spreadsheet. Element Reports: A description of the column heading abbreviations is given NEW Check to view temperatures in degrees Farenheit. Default is degrees Centigrade. Select Report Content Series FormatView Current tableLast 30 days 2003 2004Water Year 2005January 2006 February 2007March 2008April 2009May 2001 June 2011 July 2012 August Soil & Air Temperature (2002-08-19) Accumulated Precipitation (1979-10-01) Accumulated Precipitation& Snow (1979-10-01) HourlyLast 7 days 12 AM 3 AM 6 AM 9 AM 12 PM 3 PM 6 PM 9 PM 23 24 25 26 27 28 29 30 - 31 chart Last 24 hours Water Year Air Temperature (1979-10-01) Snow Depth (2002-08-19) Snow Water Equivalent (1979-10-01) Soil Moisture Percent (2002-08-19) Soil Temperature (2002-08-19 Check here to view reports in new window. http://www.wcc.nrcs.usda.govwcc/sensors (Note: to get the daily precipitation, you will have to calculate it from the (cumulative) 'Year-to-Date Precipitation' values shown in the table.) If the file opens in Excel (likely, since Excel is a common default for a .csv files), save the file to a known location in CSV format. Create a struct to store the data in the file (https://wcc.sc.egov.usda.govwcc/sensors): Date Snow Water Equivalent Precipitation Accumulation . Air Temperature Observed . Air Temperature Maximum Air Temperature Minimum Air Temperature Average . Snow Depth Store the date as the number of days from 10/1/2017 (hint, since there is an entry every day, this can be easily counted) Calculate the equations of the trendlines for Date vs Precipitation Accumulation, Date vs Snow Depth, Date vs Air Temp Average, and Snow Depth vs Air Temp Max Write these equations to a file with clear labelingStep by Step Solution
There are 3 Steps involved in it
Step: 1

Get Instant Access to Expert-Tailored Solutions
See step-by-step solutions with expert insights and AI powered tools for academic success
Step: 2

Step: 3

Ace Your Homework with AI
Get the answers you need in no time with our AI-driven, step-by-step assistance
Get Started


