Answered step by step
Verified Expert Solution
Question
1 Approved Answer
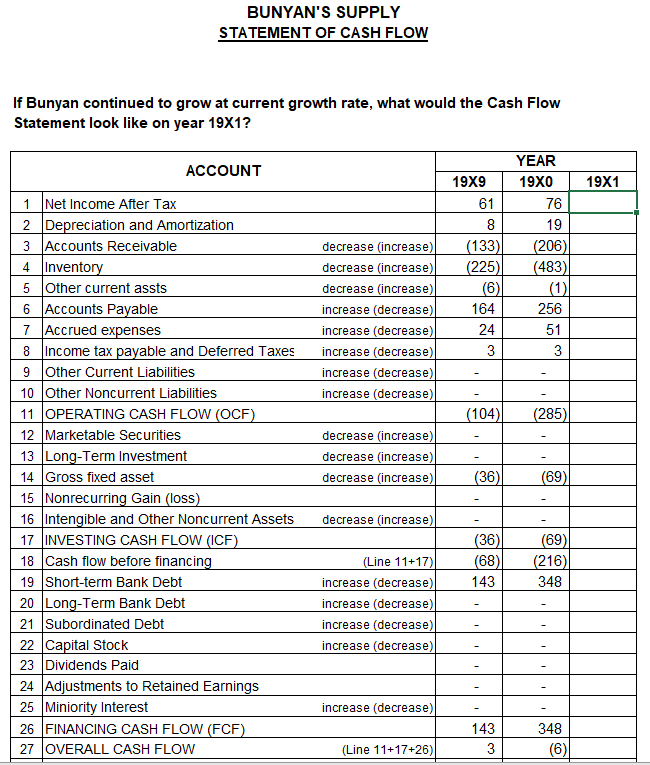
BUNYAN'S SUPPLY STATEMENT OF CASH FLOW If Bunyan continued to grow at current growth rate, what would the Cash Flow Statement look like on


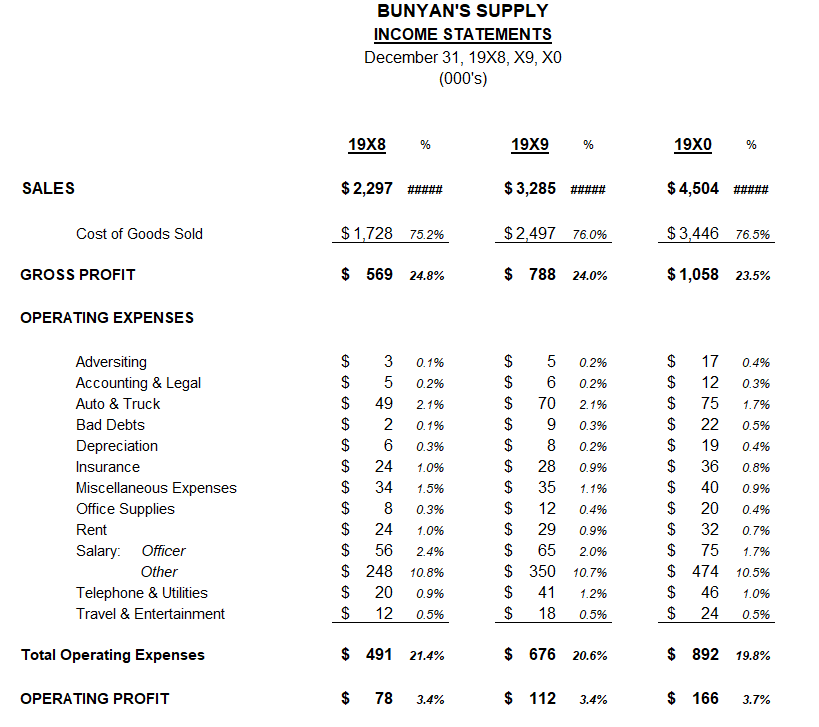
BUNYAN'S SUPPLY STATEMENT OF CASH FLOW If Bunyan continued to grow at current growth rate, what would the Cash Flow Statement look like on year 19X1? YEAR ACCOUNT 19X9 19X0 19X1 1 Net Income After Tax 61 76 2 Depreciation and Amortization 8 19 3 Accounts Receivable decrease (increase) (133) (206) 4 Inventory 5 Other current assts 6 Accounts Payable decrease (increase) (225) (483) decrease (increase) (6) (1) increase (decrease) 164 256 7 Accrued expenses increase (decrease) 24 51 8 Income tax payable and Deferred Taxes increase (decrease) 3 3 9 Other Current Liabilities increase (decrease) 10 Other Noncurrent Liabilities increase (decrease) 11 OPERATING CASH FLOW (OCF) (104) (285) 12 Marketable Securities decrease (increase) 13 Long-Term Investment decrease (increase) 14 Gross fixed asset decrease (increase) (36) (69) 15 Nonrecurring Gain (loss) 16 Intengible and Other Noncurrent Assets decrease (increase) 17 INVESTING CASH FLOW (ICF) (36) (69) 18 Cash flow before financing (Line 11+17) (68) (216) 21 Subordinated Debt 19 Short-term Bank Debt 20 Long-Term Bank Debt 22 Capital Stock increase (decrease) 143 348 increase (decrease) increase (decrease) increase (decrease) 23 Dividends Paid 24 Adjustments to Retained Earnings 25 Miniority Interest increase (decrease) 26 FINANCING CASH FLOW (FCF) 143 348 27 OVERALL CASH FLOW (Line 11+17+26) 3 (6) 28 Beginning Cash 24 27 29 Plus Operating Cash Flow (Line 11) (104) (285) 30 Investing Cash Flow (Line 17) (36) (69) 31 Financing Cash Flow (Line 26) 143 348 32 Ending Cash 27 21 BUNYAN'S SUPPLY INCOME STATEMENTS December 31, 19X8, X9, X0 (000's) 19X8 19X9 % 19X0 % SALES $2,297 ##### $ 3,285 $ 4,504 ##### Cost of Goods Sold $1,728 75.2% $2,497 76.0% $3,446 76.5% GROSS PROFIT $ 569 24.8% $ 788 24.0% $1,058 23.5% OPERATING EXPENSES Adversiting Accounting & Legal Auto & Truck $ Bad Debts Depreciation Insurance Miscellaneous Expenses Office Supplies EA EA EA SA SASA SASA 3 0.1% $ 5 0.2% $ 49 2.1% $ 2 0.1% $ 6 0.3% $ 24 1.0% $ 34 1.5% $ 8 0.3% SASASSA CA SA SA GA $ 5 0.2% $ 17 0.4% $ 6 0.2% $ 12 0.3% 70 2.1% $ 75 1.7% 9 0.3% $ 22 0.5% $ 8 0.2% 28 0.9% $ 35 1.1% 12 0.4% SA SA SA A $ 19 0.4% $ 36 0.8% $ 40 0.9% $ 20 0.4% Rent $ 24 1.0% $ 29 0.9% $ 32 0.7% Salary: Officer Other $ Telephone & Utilities SASASA $ 56 2.4% $ 65 2.0% 248 10.8% $ 350 10.7% EA A $ 75 1.7% $ 474 10.5% $ 20 0.9% $ 41 1.2% $ 46 1.0% Travel & Entertainment $ 12 0.5% $ 18 0.5% $ 24 0.5% Total Operating Expenses OPERATING PROFIT $ 491 21.4% $ 676 20.6% $ 892 19.8% $ 78 3.4% $ 112 3.4% $ 166 3.7% OTHER INCOME (EXPENSES) Interest $ (24) -1.0% $ (40) -1.2% $ (76) -1.7% PRETAX PROFIT $ 54 2.4% $ 72 2.2% $ 90 2.0% Income Tax $ 8 0.3% $ 11 0.3% $ 14 0.3% NET INCOME $ 46 2.0% $ 61 1.9% $ 76 1.7%
Step by Step Solution
There are 3 Steps involved in it
Step: 1

Get Instant Access to Expert-Tailored Solutions
See step-by-step solutions with expert insights and AI powered tools for academic success
Step: 2

Step: 3

Ace Your Homework with AI
Get the answers you need in no time with our AI-driven, step-by-step assistance
Get Started


