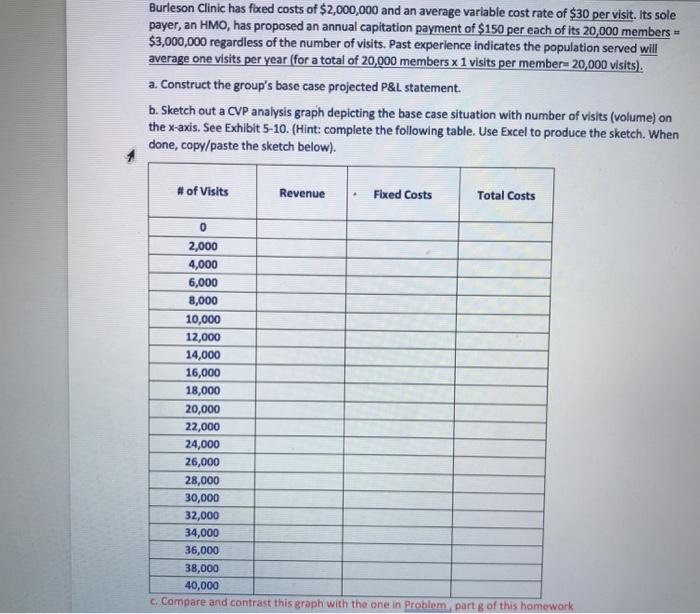
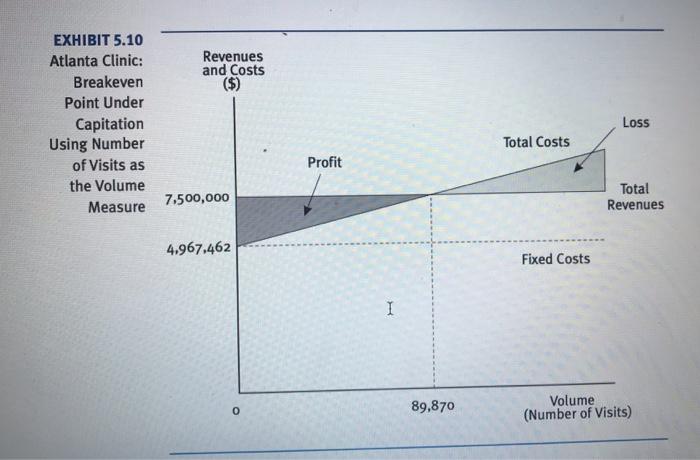
Burleson Clinic has fixed costs of $2,000,000 and an average variable cost rate of $30 per visit. Its sole payer, an HMO, has proposed an annual capitation payment of $150 per each of its 20,000 members - $3,000,000 regardless of the number of visits. Past experience indicates the population served will average one visits per year (for a total of 20,000 members x1 visits per member-20,000 visits). a Construct the group's base case projected P&L statement. b. Sketch out a CVP analysis graph depicting the base case situation with number of visits (volume) on the x-axis. See Exhibit 5-10. (Hint: complete the following table. Use Excel to produce the sketch. When done, copy/paste the sketch below). # of Visits Revenue Fixed Costs Total Costs 0 2,000 4,000 6,000 8,000 10,000 12,000 14,000 16,000 18,000 20,000 22,000 24,000 26,000 28,000 30,000 32,000 34,000 36,000 38,000 40,000 c. Compare and contrast this graph with the one in Problem, part of this homework Revenues and Costs ($) EXHIBIT 5.10 Atlanta Clinic: Breakeven Point Under Capitation Using Number of Visits as the Volume Measure Loss Total Costs Profit 7,500,000 Total Revenues 4.967,462 Fixed Costs 1 0 89,870 Volume (Number of Visits) Burleson Clinic has fixed costs of $2,000,000 and an average variable cost rate of $30 per visit. Its sole payer, an HMO, has proposed an annual capitation payment of $150 per each of its 20,000 members - $3,000,000 regardless of the number of visits. Past experience indicates the population served will average one visits per year (for a total of 20,000 members x1 visits per member-20,000 visits). a Construct the group's base case projected P&L statement. b. Sketch out a CVP analysis graph depicting the base case situation with number of visits (volume) on the x-axis. See Exhibit 5-10. (Hint: complete the following table. Use Excel to produce the sketch. When done, copy/paste the sketch below). # of Visits Revenue Fixed Costs Total Costs 0 2,000 4,000 6,000 8,000 10,000 12,000 14,000 16,000 18,000 20,000 22,000 24,000 26,000 28,000 30,000 32,000 34,000 36,000 38,000 40,000 c. Compare and contrast this graph with the one in Problem, part of this homework Revenues and Costs ($) EXHIBIT 5.10 Atlanta Clinic: Breakeven Point Under Capitation Using Number of Visits as the Volume Measure Loss Total Costs Profit 7,500,000 Total Revenues 4.967,462 Fixed Costs 1 0 89,870 Volume (Number of Visits)


