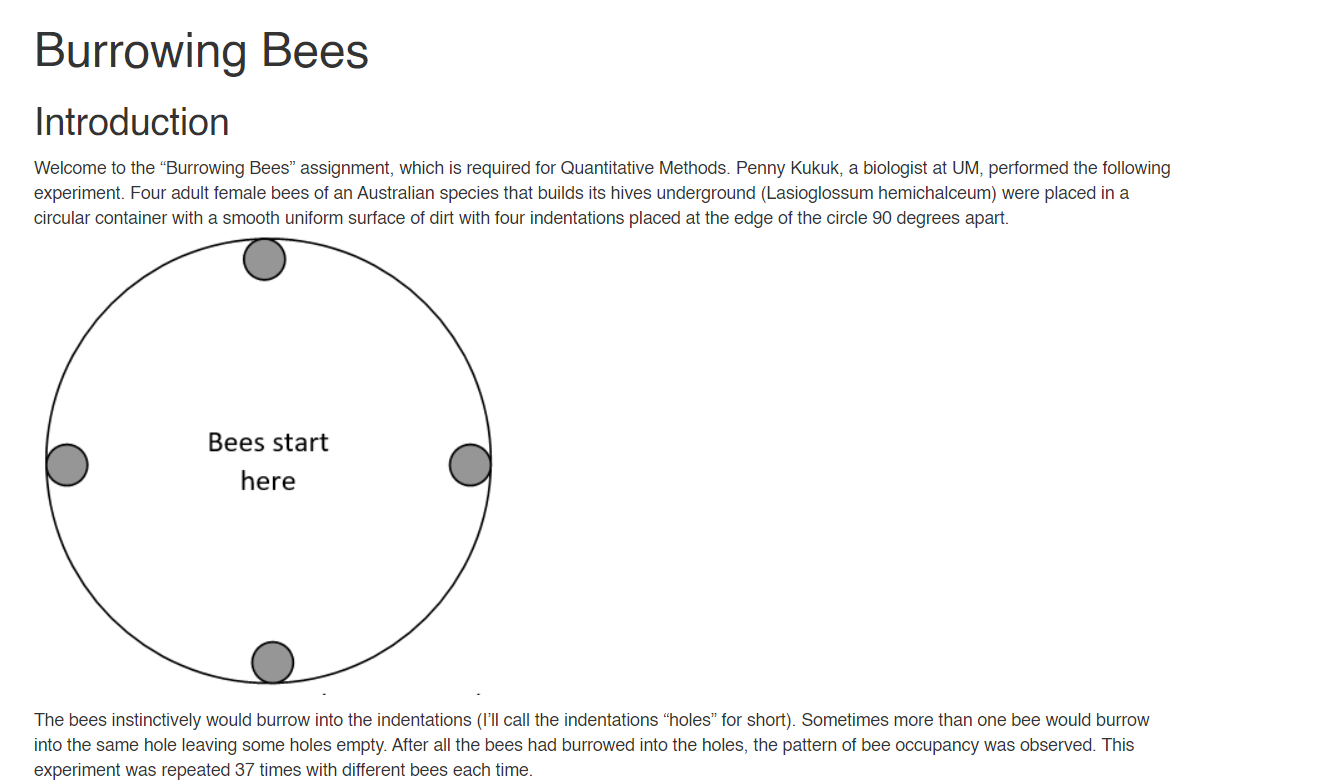
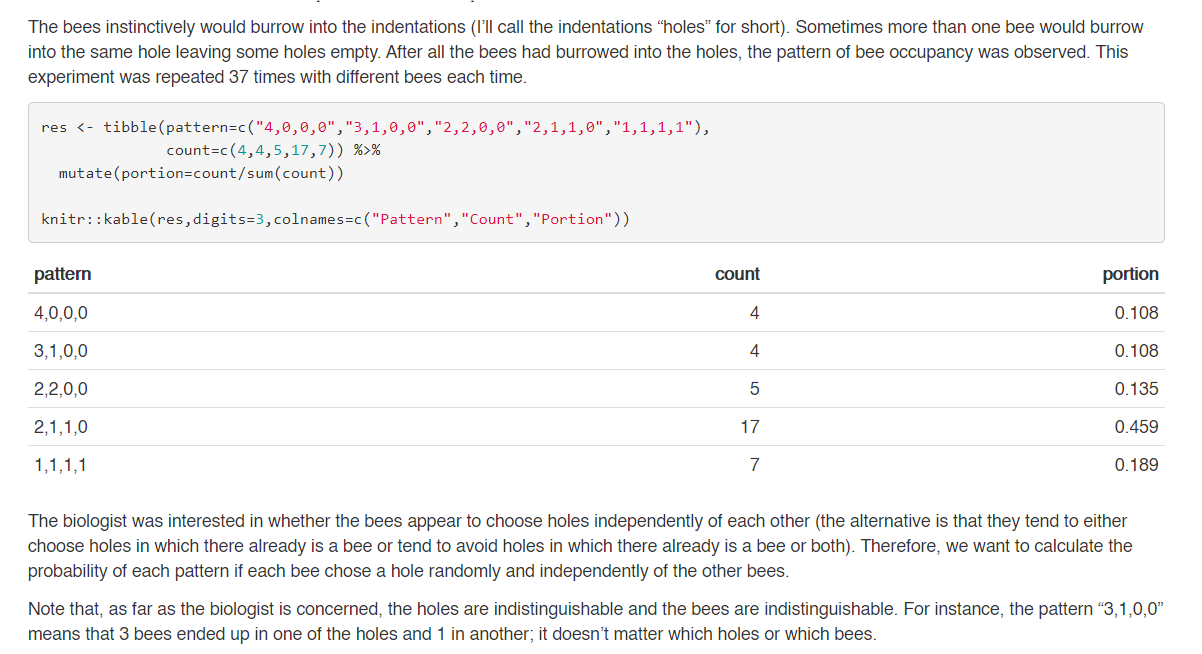
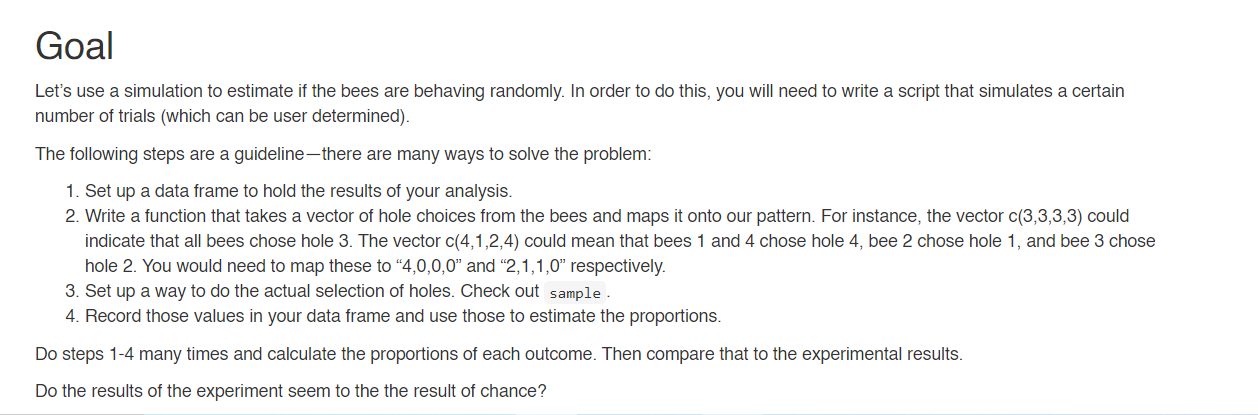
Burrowing Bees Introduction Welcome to the Burrowing Bees assignment, which is required for Quantitative Methods. Penny Kukuk, a biologist at UM, performed the following experiment. Four adult female bees of an Australian species that builds its hives underground (Lasioglossum hemichalceum) were placed in a circular container with a smooth uniform surface of dirt with four indentations placed at the edge of the circle 90 degrees apart. Bees start here The bees instinctively would burrow into the indentations (I'll call the indentations holes for short). Sometimes more than one bee would burrow into the same hole leaving some holes empty. After all the bees had burrowed into the holes, the pattern of bee occupancy was observed. This experiment was repeated 37 times with different bees each time. The bees instinctively would burrow into the indentations (I'll call the indentations "holes" for short). Sometimes more than one bee would burrow into the same hole leaving some holes empty. After all the bees had burrowed into the holes, the pattern of bee occupancy was observed. This experiment was repeated 37 times with different bees each time. res % mutate portion=count/sum(count)) knitr:: kable(res, digits=3,colnames=c("Pattern", "Count", "Portion")) pattern count portion 4,0,0,0 4 0.108 3,1,0,0 4 0.108 2,2,0,0 5 0.135 2,1,1,0 17 0.459 1,1,1,1 7 0.189 The biologist was interested in whether the bees appear to choose holes independently of each other (the alternative is that they tend to either choose holes in which there already is a bee or tend to avoid holes in which there already is a bee or both). Therefore, we want to calculate the probability of each pattern if each bee chose a hole randomly and independently of the other bees. Note that, as far as the biologist is concerned, the holes are indistinguishable and the bees are indistinguishable. For instance, the pattern "3,1,0,0" means that 3 bees ended up in one of the holes and 1 in another, it doesn't matter which holes or which bees. Goal Let's use a simulation to estimate if the bees are behaving randomly. In order to do this, you will need to write a script that simulates a certain number of trials (which can be user determined). The following steps are a guideline-there are many ways to solve the problem: 1. Set up a data frame to hold the results of your analysis. 2. Write a function that takes a vector of hole choices from the bees and maps it onto our pattern. For instance, the vector c(3,3,3,3) could indicate that all bees chose hole 3. The vector c(4,1,2,4) could mean that bees 1 and 4 chose hole 4, bee 2 chose hole 1, and bee 3 chose hole 2. You would need to map these to "4,0,0,0" and "2,1,1,0" respectively. 3. Set up a way to do the actual selection of holes. Check out sample. 4. Record those values in your data frame and use those to estimate the proportions. Do steps 1-4 many times and calculate the proportions of each outcome. Then compare that to the experimental results. Do the results of the experiment seem to the the result of chance? Burrowing Bees Introduction Welcome to the Burrowing Bees assignment, which is required for Quantitative Methods. Penny Kukuk, a biologist at UM, performed the following experiment. Four adult female bees of an Australian species that builds its hives underground (Lasioglossum hemichalceum) were placed in a circular container with a smooth uniform surface of dirt with four indentations placed at the edge of the circle 90 degrees apart. Bees start here The bees instinctively would burrow into the indentations (I'll call the indentations holes for short). Sometimes more than one bee would burrow into the same hole leaving some holes empty. After all the bees had burrowed into the holes, the pattern of bee occupancy was observed. This experiment was repeated 37 times with different bees each time. The bees instinctively would burrow into the indentations (I'll call the indentations "holes" for short). Sometimes more than one bee would burrow into the same hole leaving some holes empty. After all the bees had burrowed into the holes, the pattern of bee occupancy was observed. This experiment was repeated 37 times with different bees each time. res % mutate portion=count/sum(count)) knitr:: kable(res, digits=3,colnames=c("Pattern", "Count", "Portion")) pattern count portion 4,0,0,0 4 0.108 3,1,0,0 4 0.108 2,2,0,0 5 0.135 2,1,1,0 17 0.459 1,1,1,1 7 0.189 The biologist was interested in whether the bees appear to choose holes independently of each other (the alternative is that they tend to either choose holes in which there already is a bee or tend to avoid holes in which there already is a bee or both). Therefore, we want to calculate the probability of each pattern if each bee chose a hole randomly and independently of the other bees. Note that, as far as the biologist is concerned, the holes are indistinguishable and the bees are indistinguishable. For instance, the pattern "3,1,0,0" means that 3 bees ended up in one of the holes and 1 in another, it doesn't matter which holes or which bees. Goal Let's use a simulation to estimate if the bees are behaving randomly. In order to do this, you will need to write a script that simulates a certain number of trials (which can be user determined). The following steps are a guideline-there are many ways to solve the problem: 1. Set up a data frame to hold the results of your analysis. 2. Write a function that takes a vector of hole choices from the bees and maps it onto our pattern. For instance, the vector c(3,3,3,3) could indicate that all bees chose hole 3. The vector c(4,1,2,4) could mean that bees 1 and 4 chose hole 4, bee 2 chose hole 1, and bee 3 chose hole 2. You would need to map these to "4,0,0,0" and "2,1,1,0" respectively. 3. Set up a way to do the actual selection of holes. Check out sample. 4. Record those values in your data frame and use those to estimate the proportions. Do steps 1-4 many times and calculate the proportions of each outcome. Then compare that to the experimental results. Do the results of the experiment seem to the the result of chance