

Question: The signal graph for f(t) is shown in Figure (1) below. f(t) 3 Figure (1) (a) (b) Develop an appropriate periodic function to describe
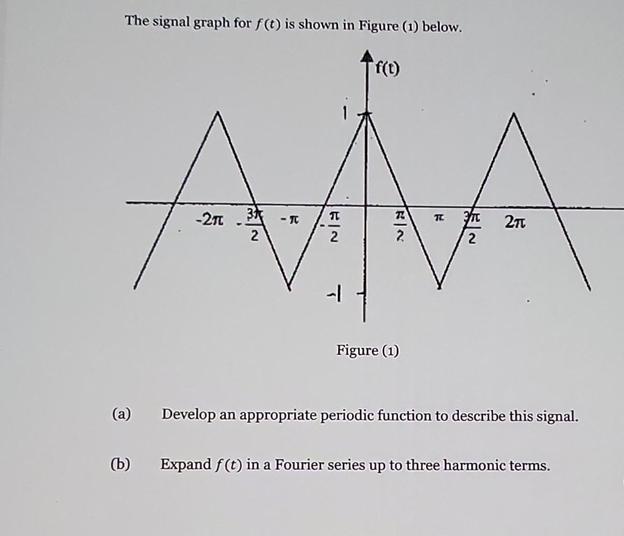
The signal graph for f(t) is shown in Figure (1) below. f(t) 3 Figure (1) (a) (b) Develop an appropriate periodic function to describe this signal. Expand f(t) in a Fourier series up to three harmonic terms.
Step by Step Solution
There are 3 Steps involved in it
1 Expert Approved Answer
Step: 1 Unlock

Part a Develop an appropriate periodic function to describe the signal The signal in the graph is a ... View full answer
Question Has Been Solved by an Expert!
Get step-by-step solutions from verified subject matter experts
Step: 2 Unlock
Step: 3 Unlock